Staged Optimization Design for Updating Urban Drainage Systems in a City of China


1
State Key Laboratory of Hydraulic Engineering Simulation and Safety, Tianjin University, Tianjin 300072, China
2
Frontier Technology Research Institute, Tianjin University, Tianjin 301700, China
*
Author to whom correspondence should be addressed.
Water 2018, 10(1), 66; https://doi.org/10.3390/w10010066
Submission received: 18 November 2017
/
Revised: 1 January 2018
/
Accepted: 11 January 2018
/
Published: 13 January 2018
Abstract
:Flooding has been reported more often than in the past in most cities of China in recent years. In response, China’s State Council has urged the 36 largest cities to update the preparedness to handle the 50-year rainfall, which would be a massive project with large investments. We propose a staged optimization design for updating urban drainage that is not only a flexible option against environmental changes, but also an effective way to reduce the cost of the project. The staged cost optimization model involving the hydraulic model was developed in Fuzhou City, China. This model was established to minimize the total present costs, including intervention costs and flooding costs, with full consideration of the constraints of specific local conditions. The results show that considerable financial savings could be achieved by a staged design rather than the implement-once scheme. The model’s sensitivities to four data parameters were analyzed, including rainfall increase rate, flood unit cost, storage unit cost, and discount rate. The results confirm the applicability and robustness of the model for updating drainage systems to meet the requirements. The findings of this study may have important implications on urban flood management in the cities of developing countries with limited construction investments.
1. Introduction
The observation of increased urban flooding events has become a serious issue in many parts of the world [1,2,3]. In China, the urban flooding events caused great economic damage and some casualties have been widely reported in recent years [4,5,6]. Only in 2012, many mega-cities such as Beijing, Shanghai, Wuhan, Guangzhou, Shenzhen, Chongqing and Nanjing, experienced serious flooding, particularly the July 2012 flood disaster in Beijing City killing 79 people and causing the loss of at least 10 billion Yuan [4,7,8]. From 2008 to 2010, 62 percent of 351 cities surveyed in China suffered flooding events, and among them 137 cities experienced flooding three times according to the statistics released by China’s government [4,9].
In response to the increased flooding events, there is an urgent need for efficient action in flooding management by the government of China. In 2013, the State Council of China released guidelines to improve urban infrastructure, in which one of the tasks was to boost infrastructure for urban flood fighting [10,11]. Following the guidelines, the drainage systems in the cities should be upgraded to handle heavy rains and prevent flood events triggered by extensive rainfall. Specifically, a relatively complete drainage system should be updated to handle a 50-year rainfall in about 15 years in the 36 largest cities, including four of the largest municipalities and capital cities. The local governments in China often ignore the development of infrastructure like drainage systems in their pursuit of economic growth, which results in the frequent flooding event reported even during moderate rains (24-h rainfall between 10.0–24.9 mm). In fact, the current drainage systems in 70% of the cities of China are not able to handle a five-year rainfall event [9,12]. This means that upgrading the drainage system in China’s cities to handle a 50-year rainfall event would be a massive project with large investments. Thus, reduction of the cost of the project is a key concern and could significantly benefit these cities. An optimization design for updating urban drainage is an effective way to reduce the cost of the project.
Many studies have been dedicated to the optimal design of drainage facilities. There are two optimal models within drainage facility design: (1) The hydrology and hydrodynamic model [13,14]; and (2) the probabilistic cost-effective model [15]. Recently, some researchers have developed the multi-objective optimal design of drainage facilities incorporating the hydraulic model with the cost-effective model [16,17,18]. These models are developed with typical multi-objective optimal design situations such as the minimum flooding risk and cost, and common hydraulic constraints such as runoff volume and peak flow rate. However, for some of China’s cities with special objectives and constraints like local design principles, these models may be invalid [19,20]. Moreover, these previous studies focused on a small scale such as a community, to optimize the drainage facility design at the initial stages. This study, however, takes the whole urban area into consideration for the optimization of drainage facilities with special objectives and local design criteria. Furthermore, environmental change (climate change or urban expansion), which has an important impact on urban drainage, has not been taken into account in the optimal design in many previous studies [21,22,23,24]. Environmental change would increase the uncertainty of the design of urban drainage mainly because it is difficult to accurately predict the change [25,26,27]. Several researchers have attempted to develop some approaches against the uncertainties due to climate change in the design of urban drainage, such as the Real In Options (RIO) analysis [26], systematic assessment using new urban planning tools [27], and staged design [28]. Thus, to keep options open against uncertainty due to climate change for decision makers or managers, a staged optimization design is employed to update urban drainage systems. The staged design of urban drainage systems refers to developing drainage systems by stages, rather than implement-once schemes.
To prevent flooding, traditional drainage infrastructures, such as channels and pumps, have been employed in many cities of China. It is undeniable that the traditional infrastructure helps to drain floodwater. However, they may lead to an increase in impermeable areas, and are not as efficient in reducing the flood risk in some cities [29]. The sustainable urban drainage system (SUDS), using techniques as detention ponds and simulations can have better control of water drainage [30,31]. Thus, some techniques of SUDS would be proposed to be involved in the development of drainage systems in China’s cities. Certainly, considering the insufficiency of flooding control capacity in most cities of China, the traditional drainage infrastructures, like pumps, would also be involved in the update of the urban drainage system.
The purpose of this work is to propose a staged optimization design method for upgrading urban drainage systems to reduce frequent flooding in China’s cities. This design method not only has significant flexibility for urban flood management to adapt to the changing environment, but also provides an approach to saving costs while updating drainage systems. In Section 2, the staged optimization model is introduced for urban flood management, incorporating economic tools and the urban flood inundation model. A case study of Fuzhou City is taken as an example to illustrate the proposed model under the constraints of different practical and local conditions, as described in Section 3. This section also reports the model’s sensitivities to four data parameters, including rainfall increase rate, flood unit cost, storage unit cost, and discount rate. In Section 4 the discussion presented and in Section 5 conclusions are drawn.
2. Methodology
2.1. Staged Cost Optimization Model
The staged approach in the development of urban drainage is recommended and refers to developing drainage systems in stages (implemented at regular time periods), rather than traditional implement-once schemes. For example, it must implement 400,000 m3 of detention storage to enhance flood-fighting levels to handle a 50-year rainfall event in a planning period (for example, 20 years) of a city. In order to achieve this, the 400,000 m3 detention ponds could be implemented during the first year. Also, it could be achieved in two stages, where a 200,000 m3 storage can be built in the first 10 years, and a further 200,000 m3 storage in another 10 years. The approach is not only possible to defer investment, but also allows the decision makers to take into account the uncertainties due to environmental changes.
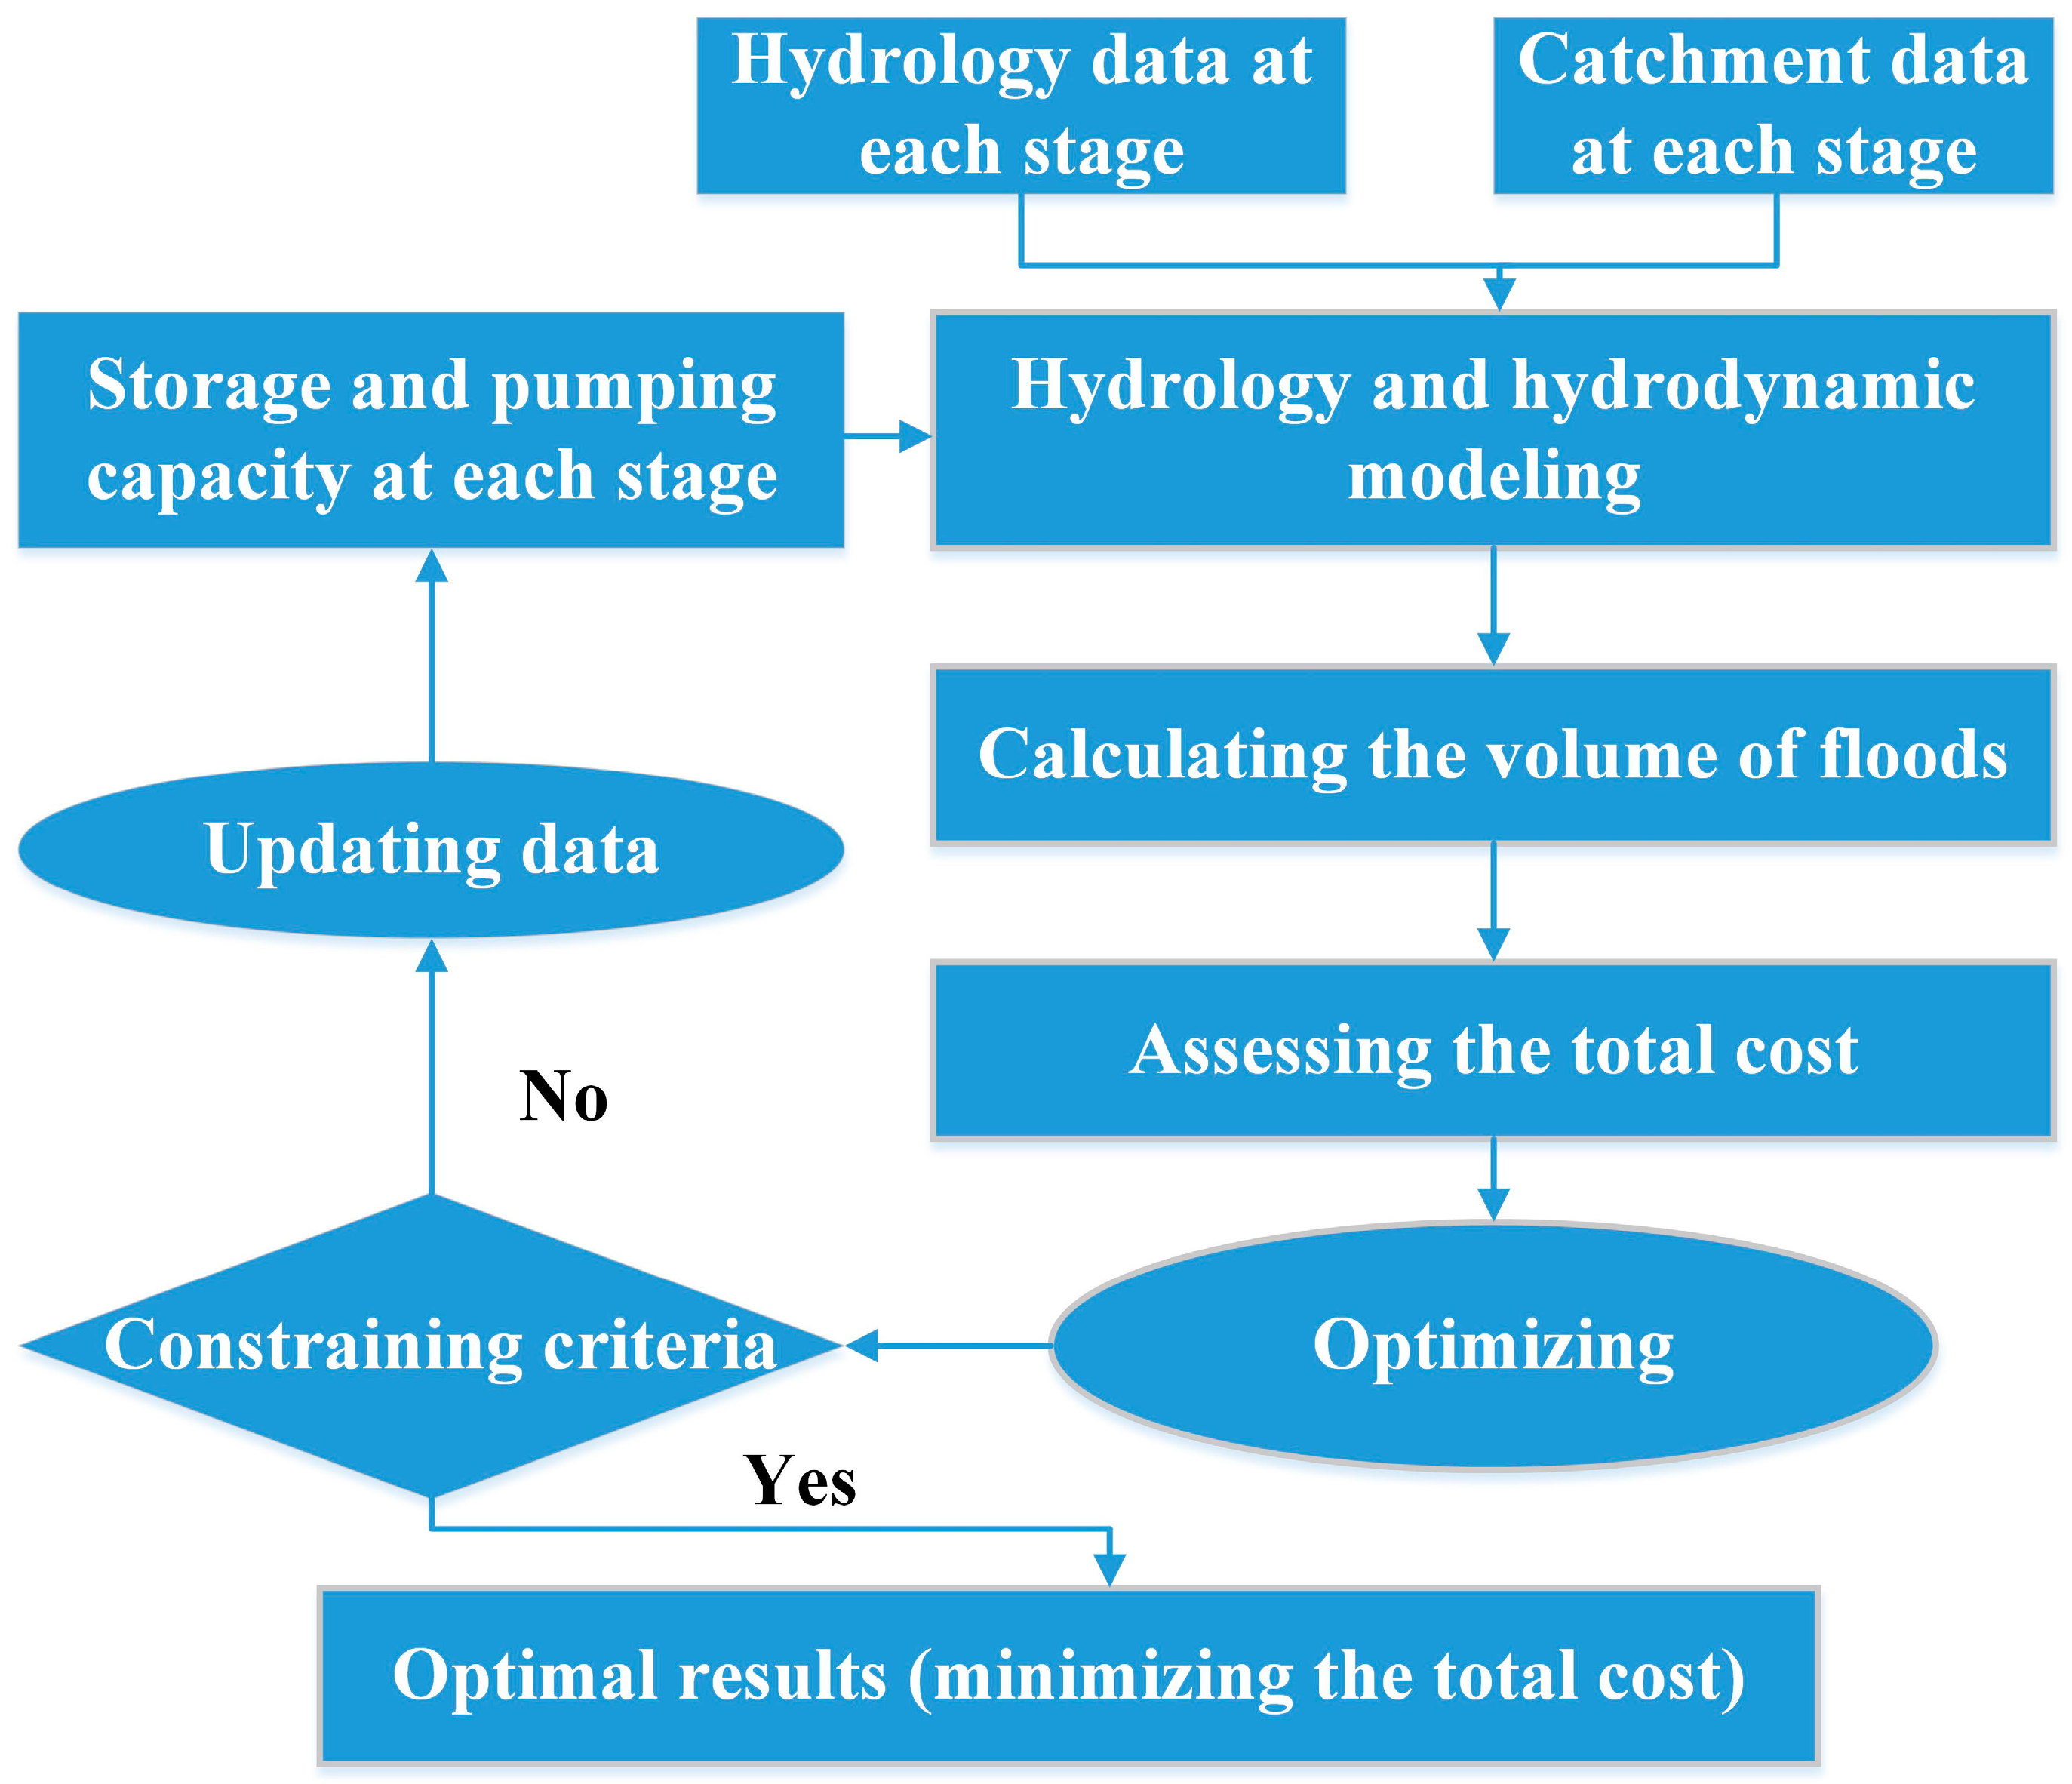
Two key measures, storage and pumping, are implemented to update the current drainage systems in Fuzhou City, China. The diagram of a staged optimization model is given in Figure 1.
The storage and pumping capacity at each stage are optimized as the decision variables in this model. The design objective is to minimize the cost including the residual flood damage and the cost of interventions. The total flood damage in the whole planning period for updating the drainage systems can be calculated as [28]:
where TPF is the total present flood cost, E(D) is the expected annual damage, n-ped is the planning period of implementation, f is the occurrence frequency of a flood event, and D(f) is the flood damage resulting from the flood event with the occurrence frequency f.
To simplify the calculation of D(f), we assume that the flood damage has a linear correlation with the flooded volume [28]. In order to simplify the calculations, the continuous integral of the right part of Equation (1) is written as a series of return periods (e.g., 2-year, 5-year, 10-year, 20-year and 50-year). Thus Equation (1) can be expressed as:
where
n-step is the time step number, m is the number of discretized return periods, j is the time step, Ri is the i-th return period, Vi is the flooded volume caused by the rainfall with Ri, Cf is the flood unit cost per unit volume, FDfj is the flood discount factor in the time step j, r is the discount rate, and is the duration of each time step.
The cost of construction of the storage and pumping facilities can be expressed as:
where
TPI is the total present cost of interventions, n-step is the time step number, CS is the unit capital cost of the storage facility per unit volume, SVj is the scale of the storage facility, CP is the unit capital cost of the pumping facility per unit discharge, PVj is the installed pumping capacity of the pumping facility, IDfj is the invention discount factor in time step j.
Thus, the optimized cost objective function z is given as:
In the construction of storage and pumping facilities, the scales should be constrained by many factors, such as the development of the city (financial budget, land use planning, acceptable levels of flood risk, etc.). Moreover, for a city in China, the most important objective of invention construction is updating the drainage system to a higher standard (50-year or 100-year) over the next decades. Thus, the storage and pumping capacity at each step is constrained by this objective during the whole planning period. The main constraints are expressed as:
where BUj is the maximum investment amount during j-th step, SVmin and SVmax are the minimum and maximum volumes of the storage facilities during j-th step respectively, PVmin and PVmax are the minimum and maximum installed pumping capacities during j-th step respectively, Tj is the pumping duration during the j-th step, VSP is the minimum added volume of updating facilities to handle a 50-year rainfall, and Vf is the minimum added volume of storage facilities to store the floodwater from mountain areas of Fuzhou City.
2.2. Calculating the Flooded Volume in Urban Areas
In Equation (2), the flooded volume V is a state variable which should be calculated in different steps with time. The flooded volume V can be computed as:
where j represents the j-th step, i represents the i-th return period, Vaj is the bearing capability of the flooded volume in this city at the j-th step, is the runoff volume at the j-th step by the i-th return period rainfall, Vpj and Vcj are the newly added storage and pumping volumes at the j-th step, respectively, and Va0 or C is a constant which represents the carrying capacity of flood volume of the city at the current state or on the benchmark year.
The hydrology and hydrodynamic modeling is established to assess the drainage capability of the city, as well as the flooded volume under different time steps. Numerous commercial software models are available to calculate the volume of floods in urban areas, such as MIKE software [32], Storm Water Management Model (SWMM) [33] and Hydrologic Engineering Center's River Analysis System (HEC-RAS) [34]. These models can be used to simulate the unsteady flow in terms of the Saint Venant equations, which are expressed as follows.
where t is time, x is the spatial variable, q is the lateral discharge per unit width, A is the flow area, Q is flow rate, Z is the water surface elevation, g is the acceleration of gravity, C is the Chezy coefficient, calculated by , with R being the hydraulic radius and n being the roughness Manning coefficient. For some cities in southeast China, such as Fuzhou and Wenzhou, rivers and conduits are the main drainage systems. Thus, the tools which can simulate flood characteristics of the surface–river interaction should be employed.
3. Case Study and Analysis
3.1. Study Area Description
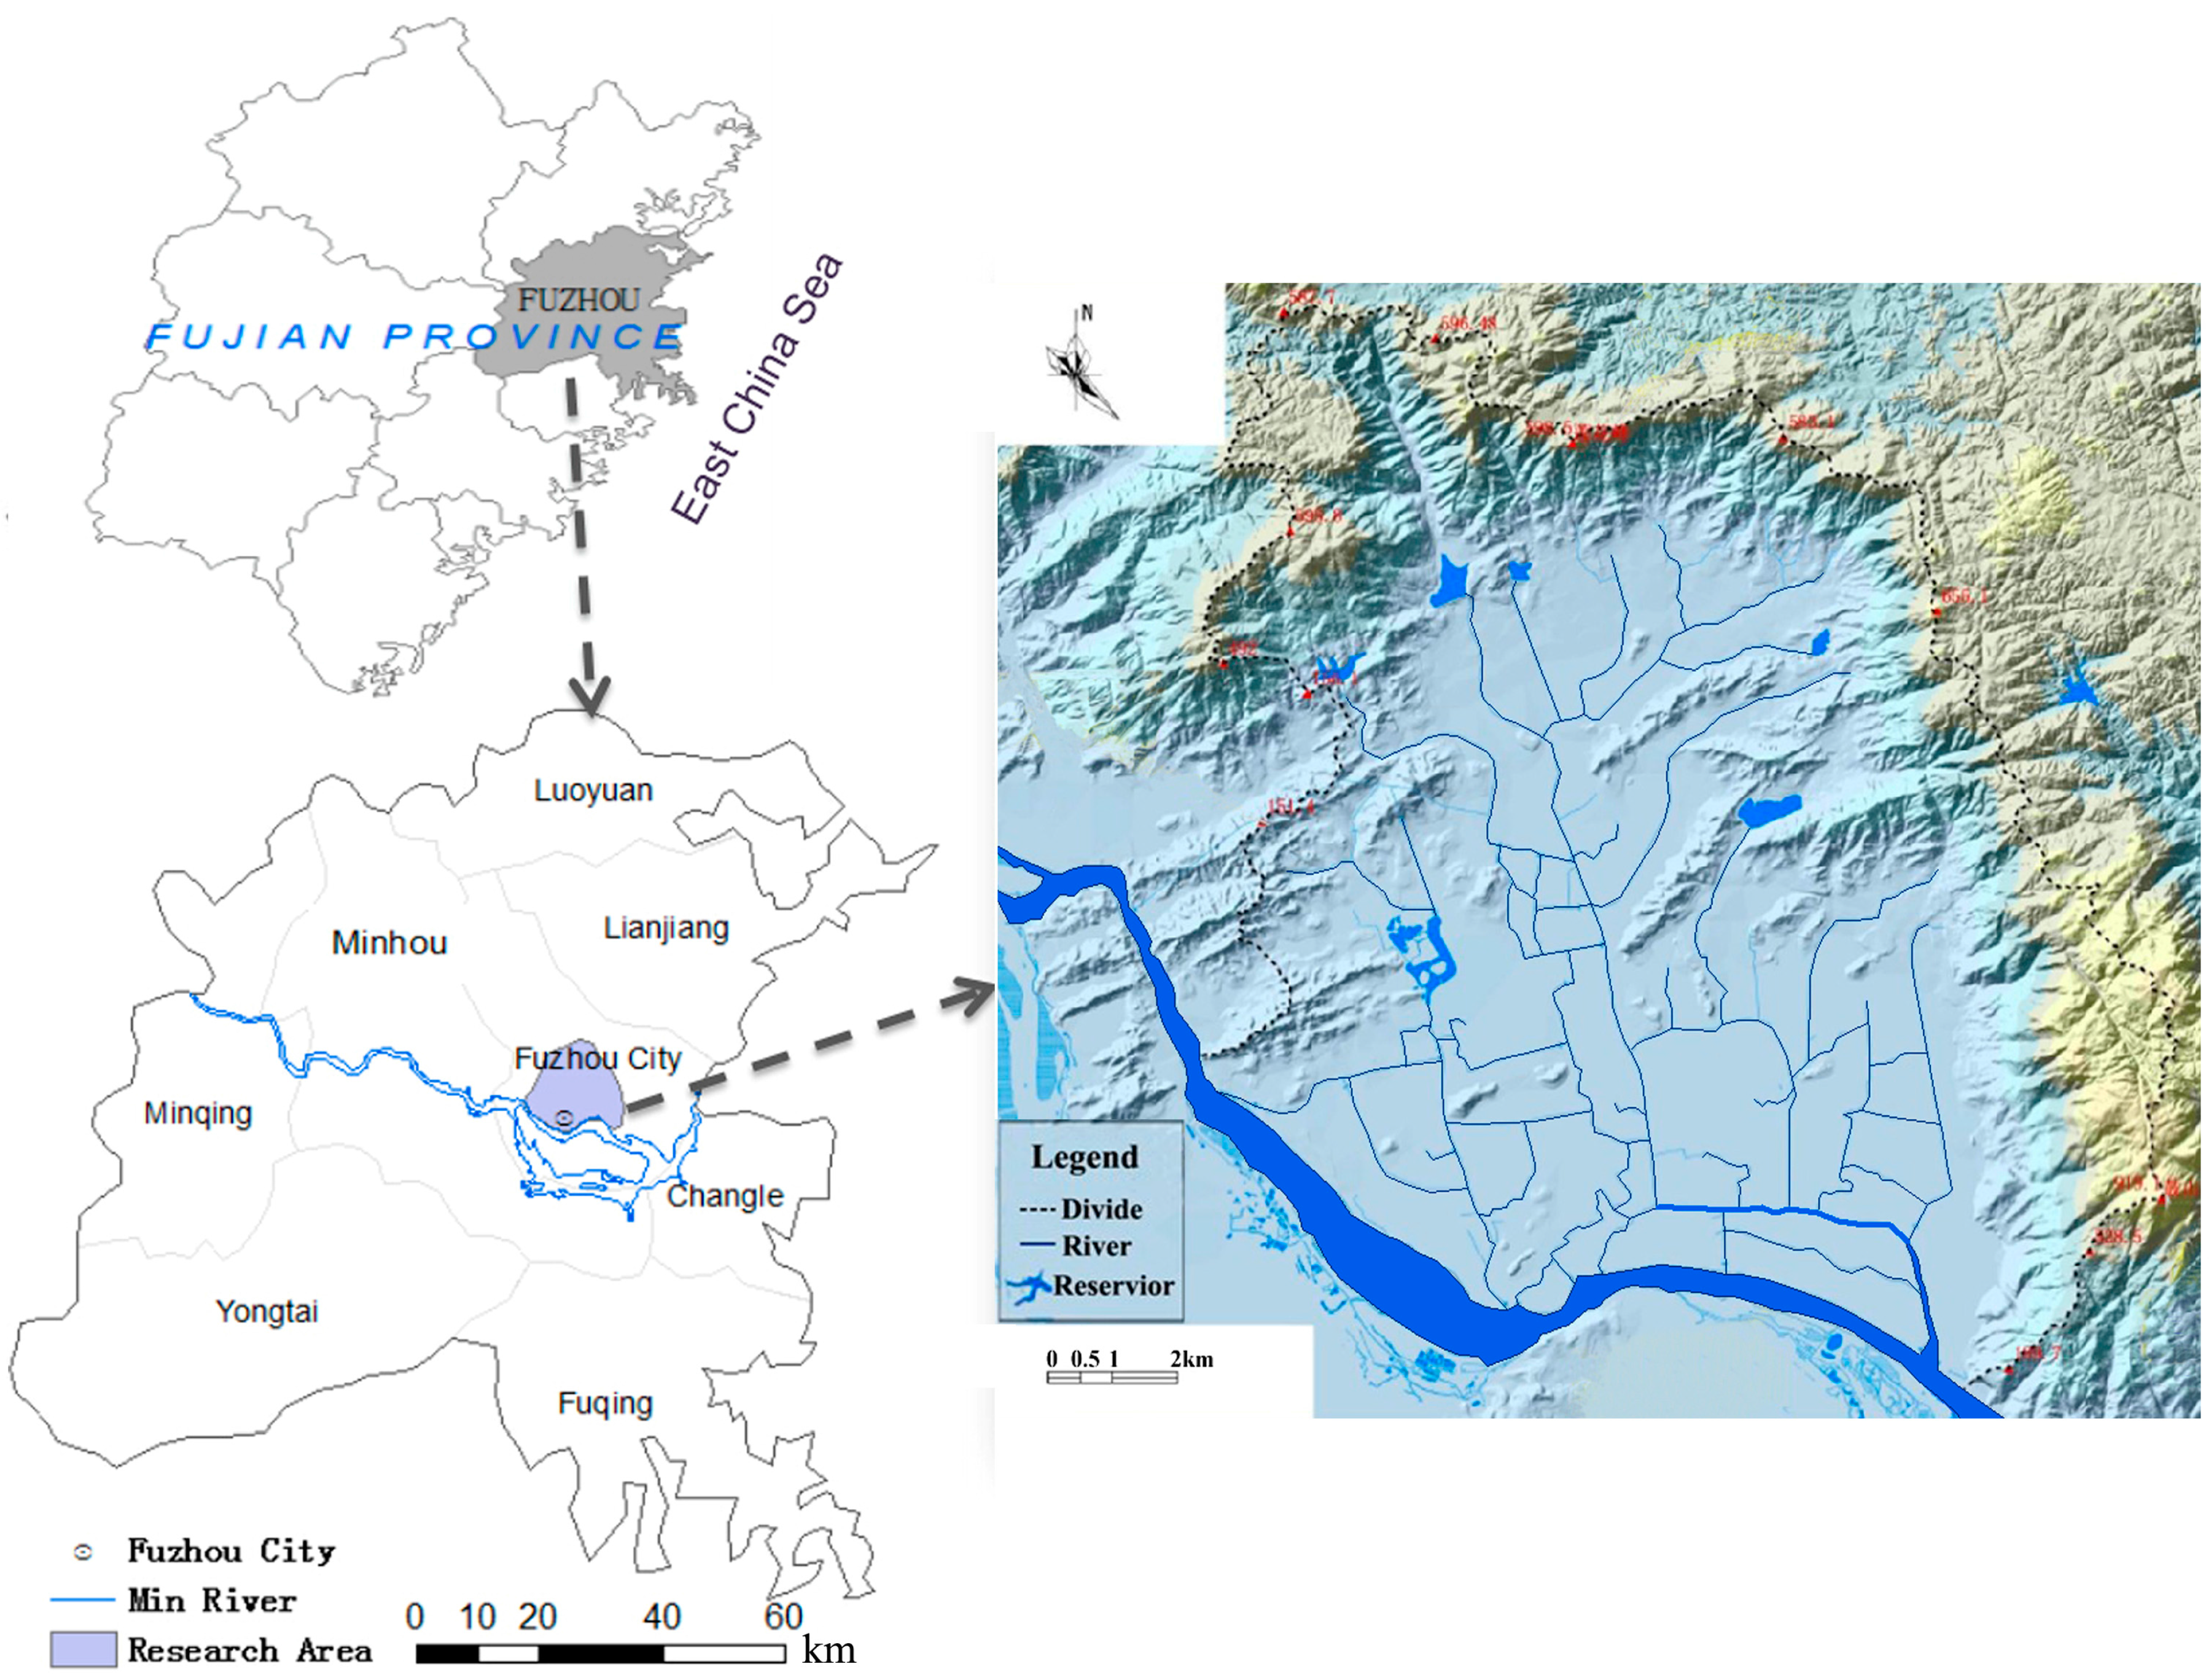
The study area, Fuzhou City is in eastern China and is surrounded on three sides by hills in the north, west, and east, and by a tidal river in the south. The area of Fuzhou is about 156.77 km2 with a hilly area of 66.72 km2 (42.56%) around a plain area of 90.05 km2 (57.44%). In the study area, dozens of conduits and rivers forming a complex drainage network undertake the main task of flood drainage (Figure 2). Heavy rains hit this city often quite abruptly in the summer seasons, with extreme rainfalls brought by typhoons. Due to the topography of this area, the floodwater would quickly converge into the center plain area from the surrounding mountains during the rain events, which increases the drainage burden in the center of the plain area. In recent years, flooding events have been frequently reported due to the overflow of the river systems in the center of this area during typhoons. The flood disasters cause huge socio-economic losses and seriously affect the activities of residents. For example, the 2005 flood event brought by Typhoon Longwang resulted in over 120,000 people evacuated and 62 dead [4].
There are two common ways to resolve flooding in cities: (1) Traditional methods, such as enlarging pipe sizes and upgrading pumping capacity and (2) low impact development (LID) approaches, such as the construction of green infrastructure. The LID approach is implemented in sustainable urban drainage systems. However, it is inefficient for heavy rains, and more applicable to small-scale (for example, a community) hydrological controls. Moreover, in Fuzhou City the government keeps planning to store the floodwater from the mountains during storm events to mitigate flooding of the city center. Thus, the storage facilities (like detention ponds) combined with a traditional measure (pumping) are recommended to update the drainage system in Fuzhou City. Storage facilities can effectively store the flash-floodwater from mountains on three sides. Meanwhile, high tide levels always aggravate the inundation by impeding the drainage of floodwater. Thus, pumping facilities can effectively pump out the floodwater that cannot flow out by itself due to the high tide level downstream.
3.2. Calculation of the Flooded Volume
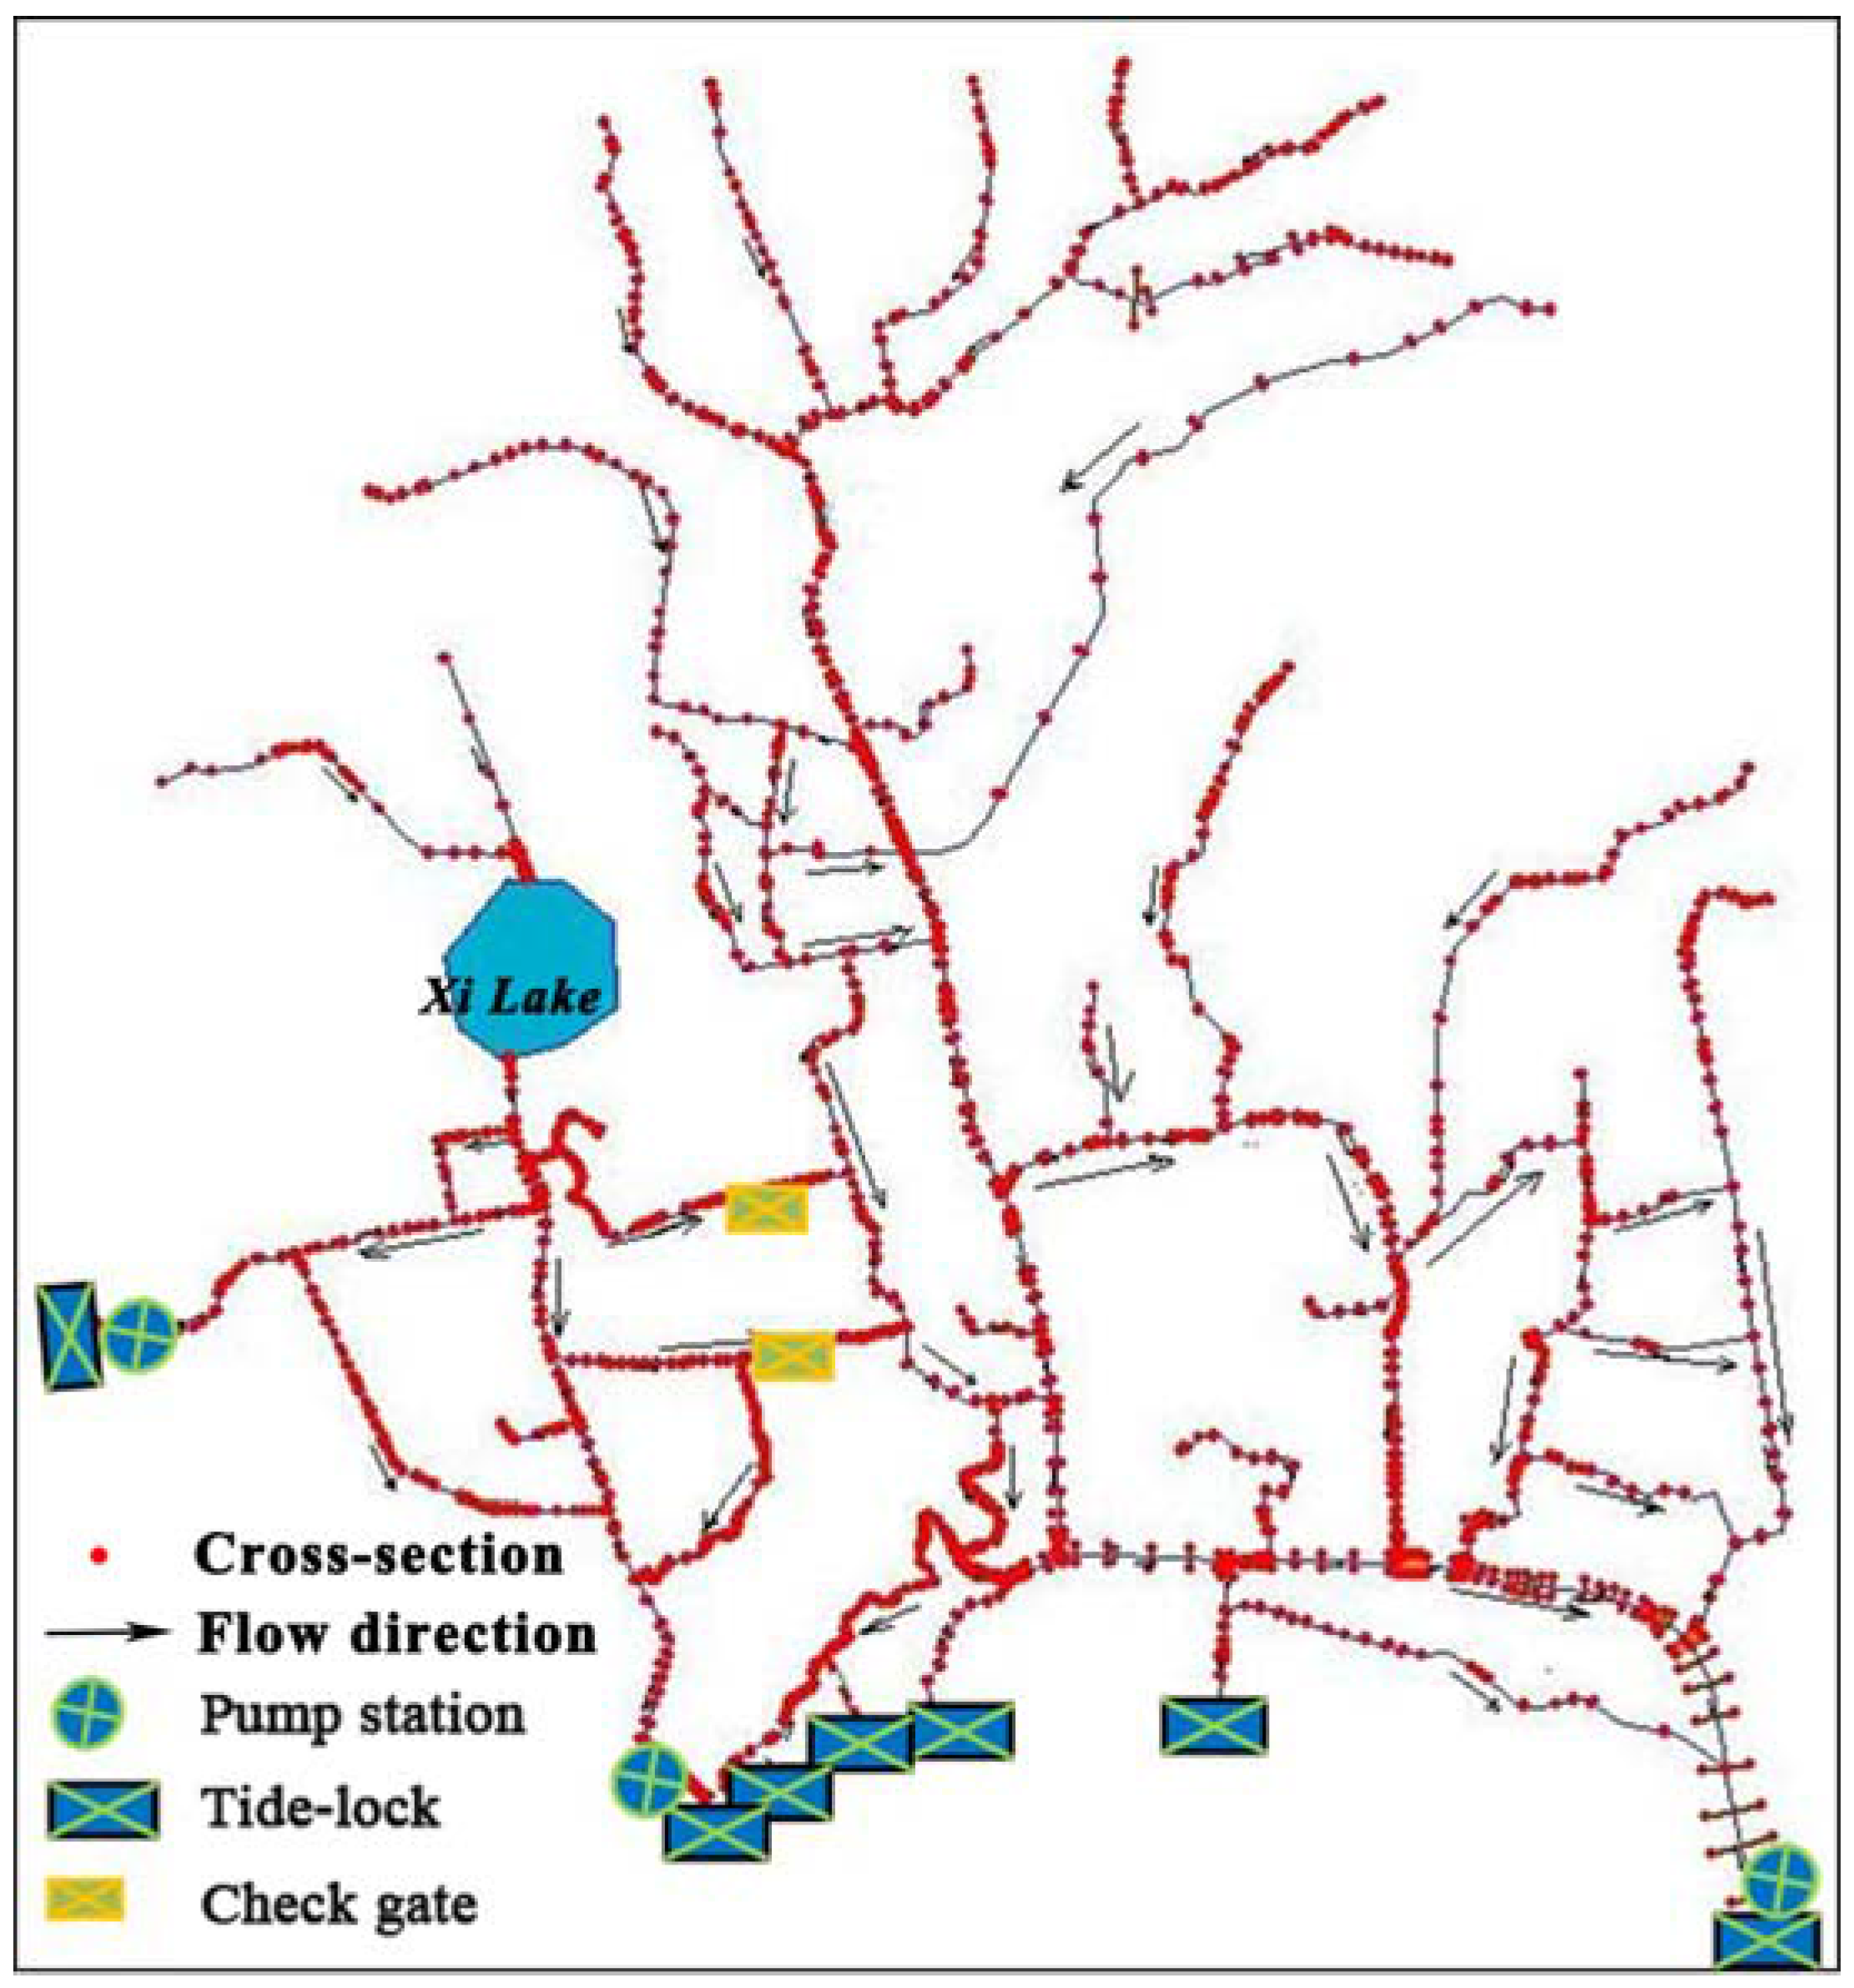
Statistically, the main reason for flooding in Fuzhou City is overflow from the complex river systems under the effect of intense rainfall. Thus, the hydrodynamic model for simulating the river system is constructed by the HEC-RAS tool [34], as shown in Figure 3. This model consists of 1713 cross-sectional profiles, three pump stations, and seven tide-locks downstream. Manning roughness coefficients with a calibrated range of 0.025 to 0.045 are provided by the Department of River Management of Fuzhou.
One of the optimal objectives is updating the drainage system to handle 24-h rainfall for a 50-year return period. Thus, runoff volumes of 24-h rainfall under different return periods are calculated in terms of the hydrological models. In mountain areas, the runoff processes and volumes are estimated by a rainfall runoff model, namely the Xinanjiang model [35]. In urban areas, the runoff processes and volumes are calculated by the rational method [36]. In the hydrology models, the 24 h rainfall processes as the input data are derived from the design 24 h rainfalls and the selected typical precipitation event. The design of 24 h rainfalls for different return periods are estimated by the Pearson type-III distribution based on the annual maximum 24 h rainfall series from 1952 to 2014. The results are shown in Table 1. The 24 h rainfall for a 50-year return period is 226.1 mm, with a runoff volume from urban areas of 9151.8 × 103 m3 and a runoff volume from mountain areas of 4730.8 × 103 m3.
Then, the design flow hydrographs with different return periods (2, 5, 10, 20, and 50 years) derived by the hydrological models are the input boundary conditions for the hydrodynamic model. The water level process and flood area during Typhoon Longwang are employed to verify the hydrodynamic model, and the details are presented in our previous research [29]. Based on the verified hydrodynamic model, the flooded volumes with original drainage systems under different design rainfalls can be calculated. Also, the capacity of original drainage systems, Va0 in Equation (11), can be evaluated.
The results show that the current drainage facilities can handle a five-year rainfall event, which means Va0 = 6076.9 + 2602.3 = 8679.2 × 103 m3. Then, the flooded volumes at different steps with the newly-added facilities can be calculated by Equation (11). In this equation, the pumping duration during each step Tj is set to 4 h as the duration of the surface runoff in most sub-catchments of the urban area is not more than 4 h.
3.3. Design of New Drainage Facilities Based on the Staged Cost Optimization Model
The two key measures, storage and pumping facilities, are implemented to update the current drainage system in Fuzhou City. The storage facilities, such as ponds, tanks, tunnels, and underground reservoirs are mainly designed to store the floodwater from mountain areas, while the pumping facilities set in the river mouth downstream are mainly designed to drain the floodwater from urban areas. For Fuzhou City, one of the goals is to update the drainage system to handle a 50-year rainfall event in the coming 15 years. Updating the facilities is implemented in five stages, meaning they are implemented during three years for one stage. Thus, in Equations (2) and (3), the value of n-step is set as five, and is set as three.
In the optimization model, there is a variety of data types needed. A part of these were discovered by empirical surveys, and another part is based on expert experience or relevant specification. The flood unit cost per unit volume, Cf in Equation (2), is 630 yuan surveyed by two flooding events in 2005 and 2006, respectively. The discount rate r is 0.8 referenced by the relevant specification. The unit capital cost of the storage facility per unit volume and of the pumping facility per unit discharge, CS and CP are set to 500 yuan and three million yuan, respectively, based on expert experience.
In Equation (7), BUj, the maximum investment amounts during the j-th step is set to 480 million yuan, determined by the local financial investment plan. SVmin and SVmax in Equation (8), the minimum and maximum volumes of the storage facilities during each step, respectively, are set at 400,000 m3 and 800,000 m3 in each step according to the land use plan. The minimum and maximum pumping capacities in each step, PVmin and PVmax, are set at 20 m3/s and 60 m3/s respectively. VSP in Equation (9), the minimum added volume for updating drainage facilities to handle a 50-year rainfall event is 5203.4 × 103 m3 calculated according to Table 1. Similarly, Vf in the Equation (10) is 2130 × 103 m3.
3.4. Design Results and Analysis
The genetic algorithm programmed in the MATLAB language was employed to optimize the storage and pumping capacity at each stage. In this study, a number of variables of 10, a population size of 20, a generation size of 400, a mutation probability of 0.3, a cross-over probability of 0.7 were set in the optimization model. The model was implemented automatically for 300 runs to get the best solution, while also trying to avoid trapping in the local optimum.
Table 2 shows the obtained optimal solutions of the storage and pumping facility plan in the coming 15 years. The results illustrate that a storage scale of 420,000 m3 and a pumping scale of 45 m3/s are to be constructed in the first three years, and then extended to a 420,000 m3 storage scale and a 45 m3/s pumping scale in the following three years, a 430,000 m3 storage scale and a 45 m3/s pumping scale after six years, a 430,000 m3 storage scale and a 46 m3/s pumping scale after nine years, and a 430,000 m3 storage scale and a 46 m3/s pumping scale in the last years. Thus, the new drainage system for this area would be able to handle a 50-year rainfall event after 15 years.
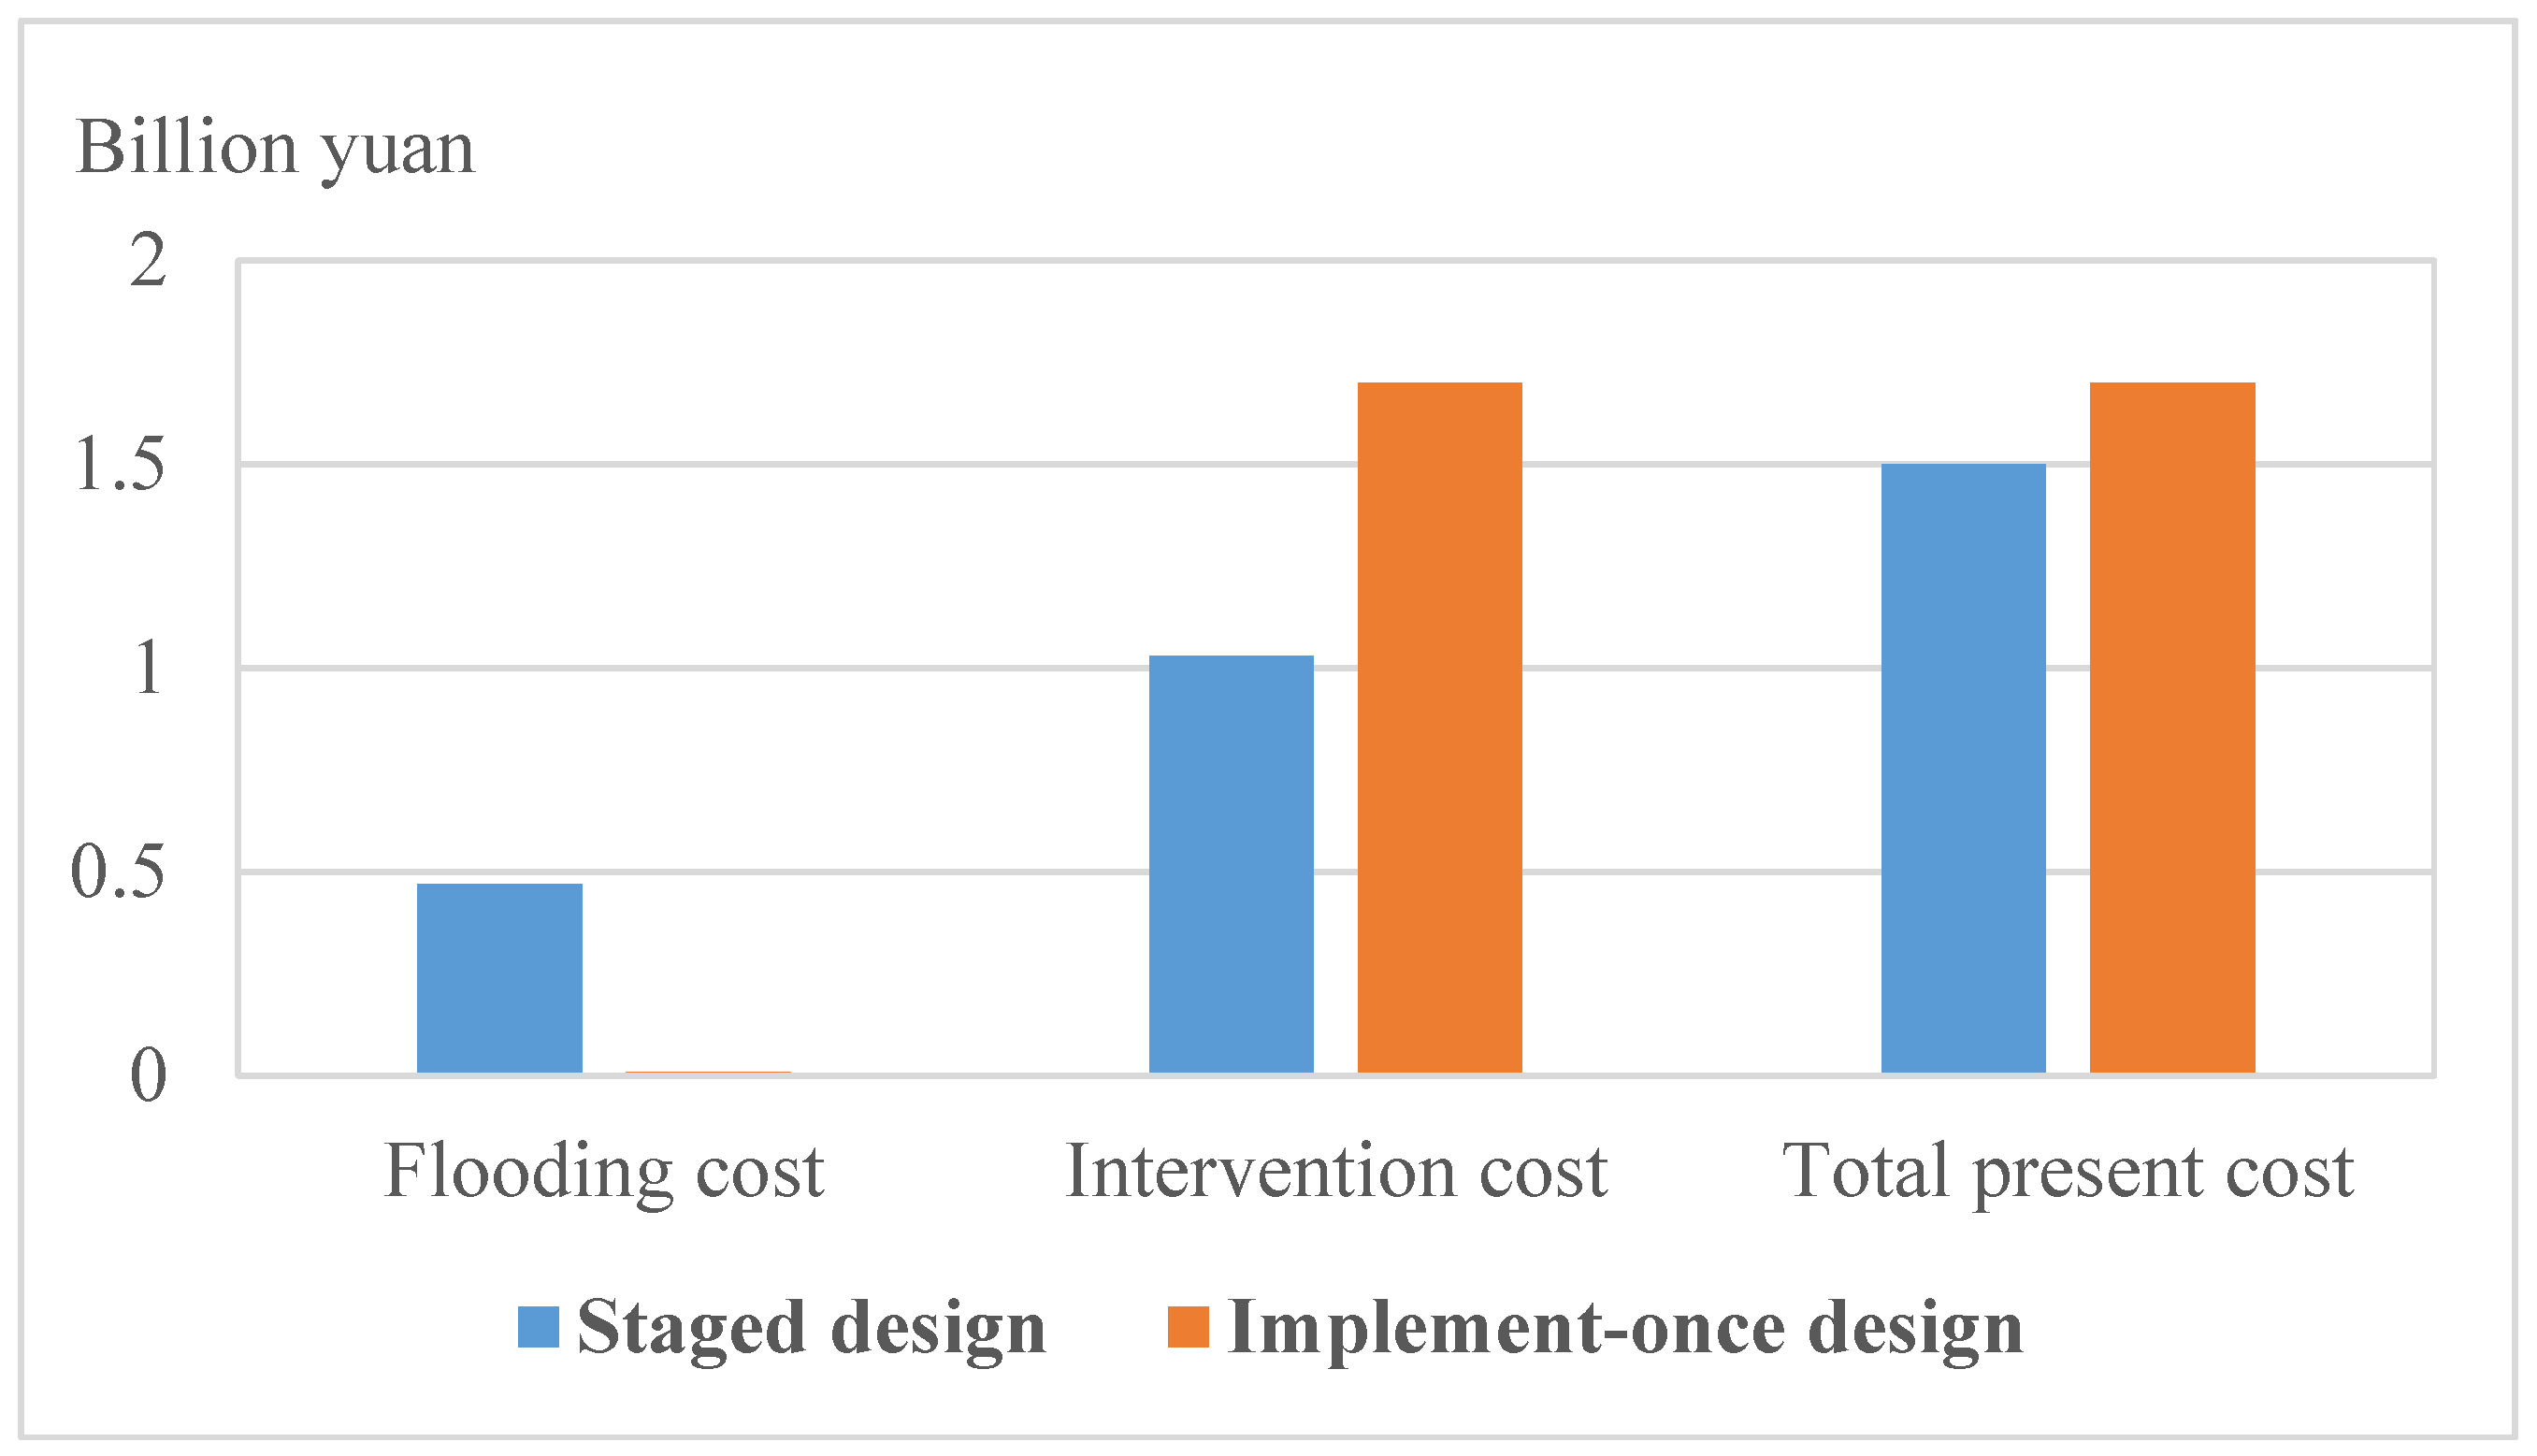
Based on the optimal solutions, the total present cost is calculated at 1.50 billion yuan, with the total present flooding cost of 0.47 billion yuan and the total present intervention cost of 1.03 billion yuan (Figure 4). In contrast, the total present cost would be 1.70 billion yuan if the interventions were completely implemented in the first year to meet the objective design standard. Figure 4 shows that the staged design is more economic than an implement-once design in the first year because the time value of money is considered.
3.5. Sensitivity to Data Parameters
According to Saltelli et al. [37], “the sensitivity analysis is defined as the study of how uncertainty in the output of a model can be attributed to different sources of uncertainty in the model input”. In the context of the present study, sensitivity analysis refers to understanding how the parameters and states (optimization design variables) of the model (Equations (6)–(10)) influence the optimization cost function (Equation (6)). The data on environmental changes, climate change and urban economic development include uncertainties that come from the incertitude of the data on rainfall increase rate, flood unit cost, storage unit cost, and discount rate. A sensitivity analysis was carried out in order to examine the influence of the above parameters on the optimization cost function, as shown in Figure 5, Figure 6, Figure 7 and Figure 8.
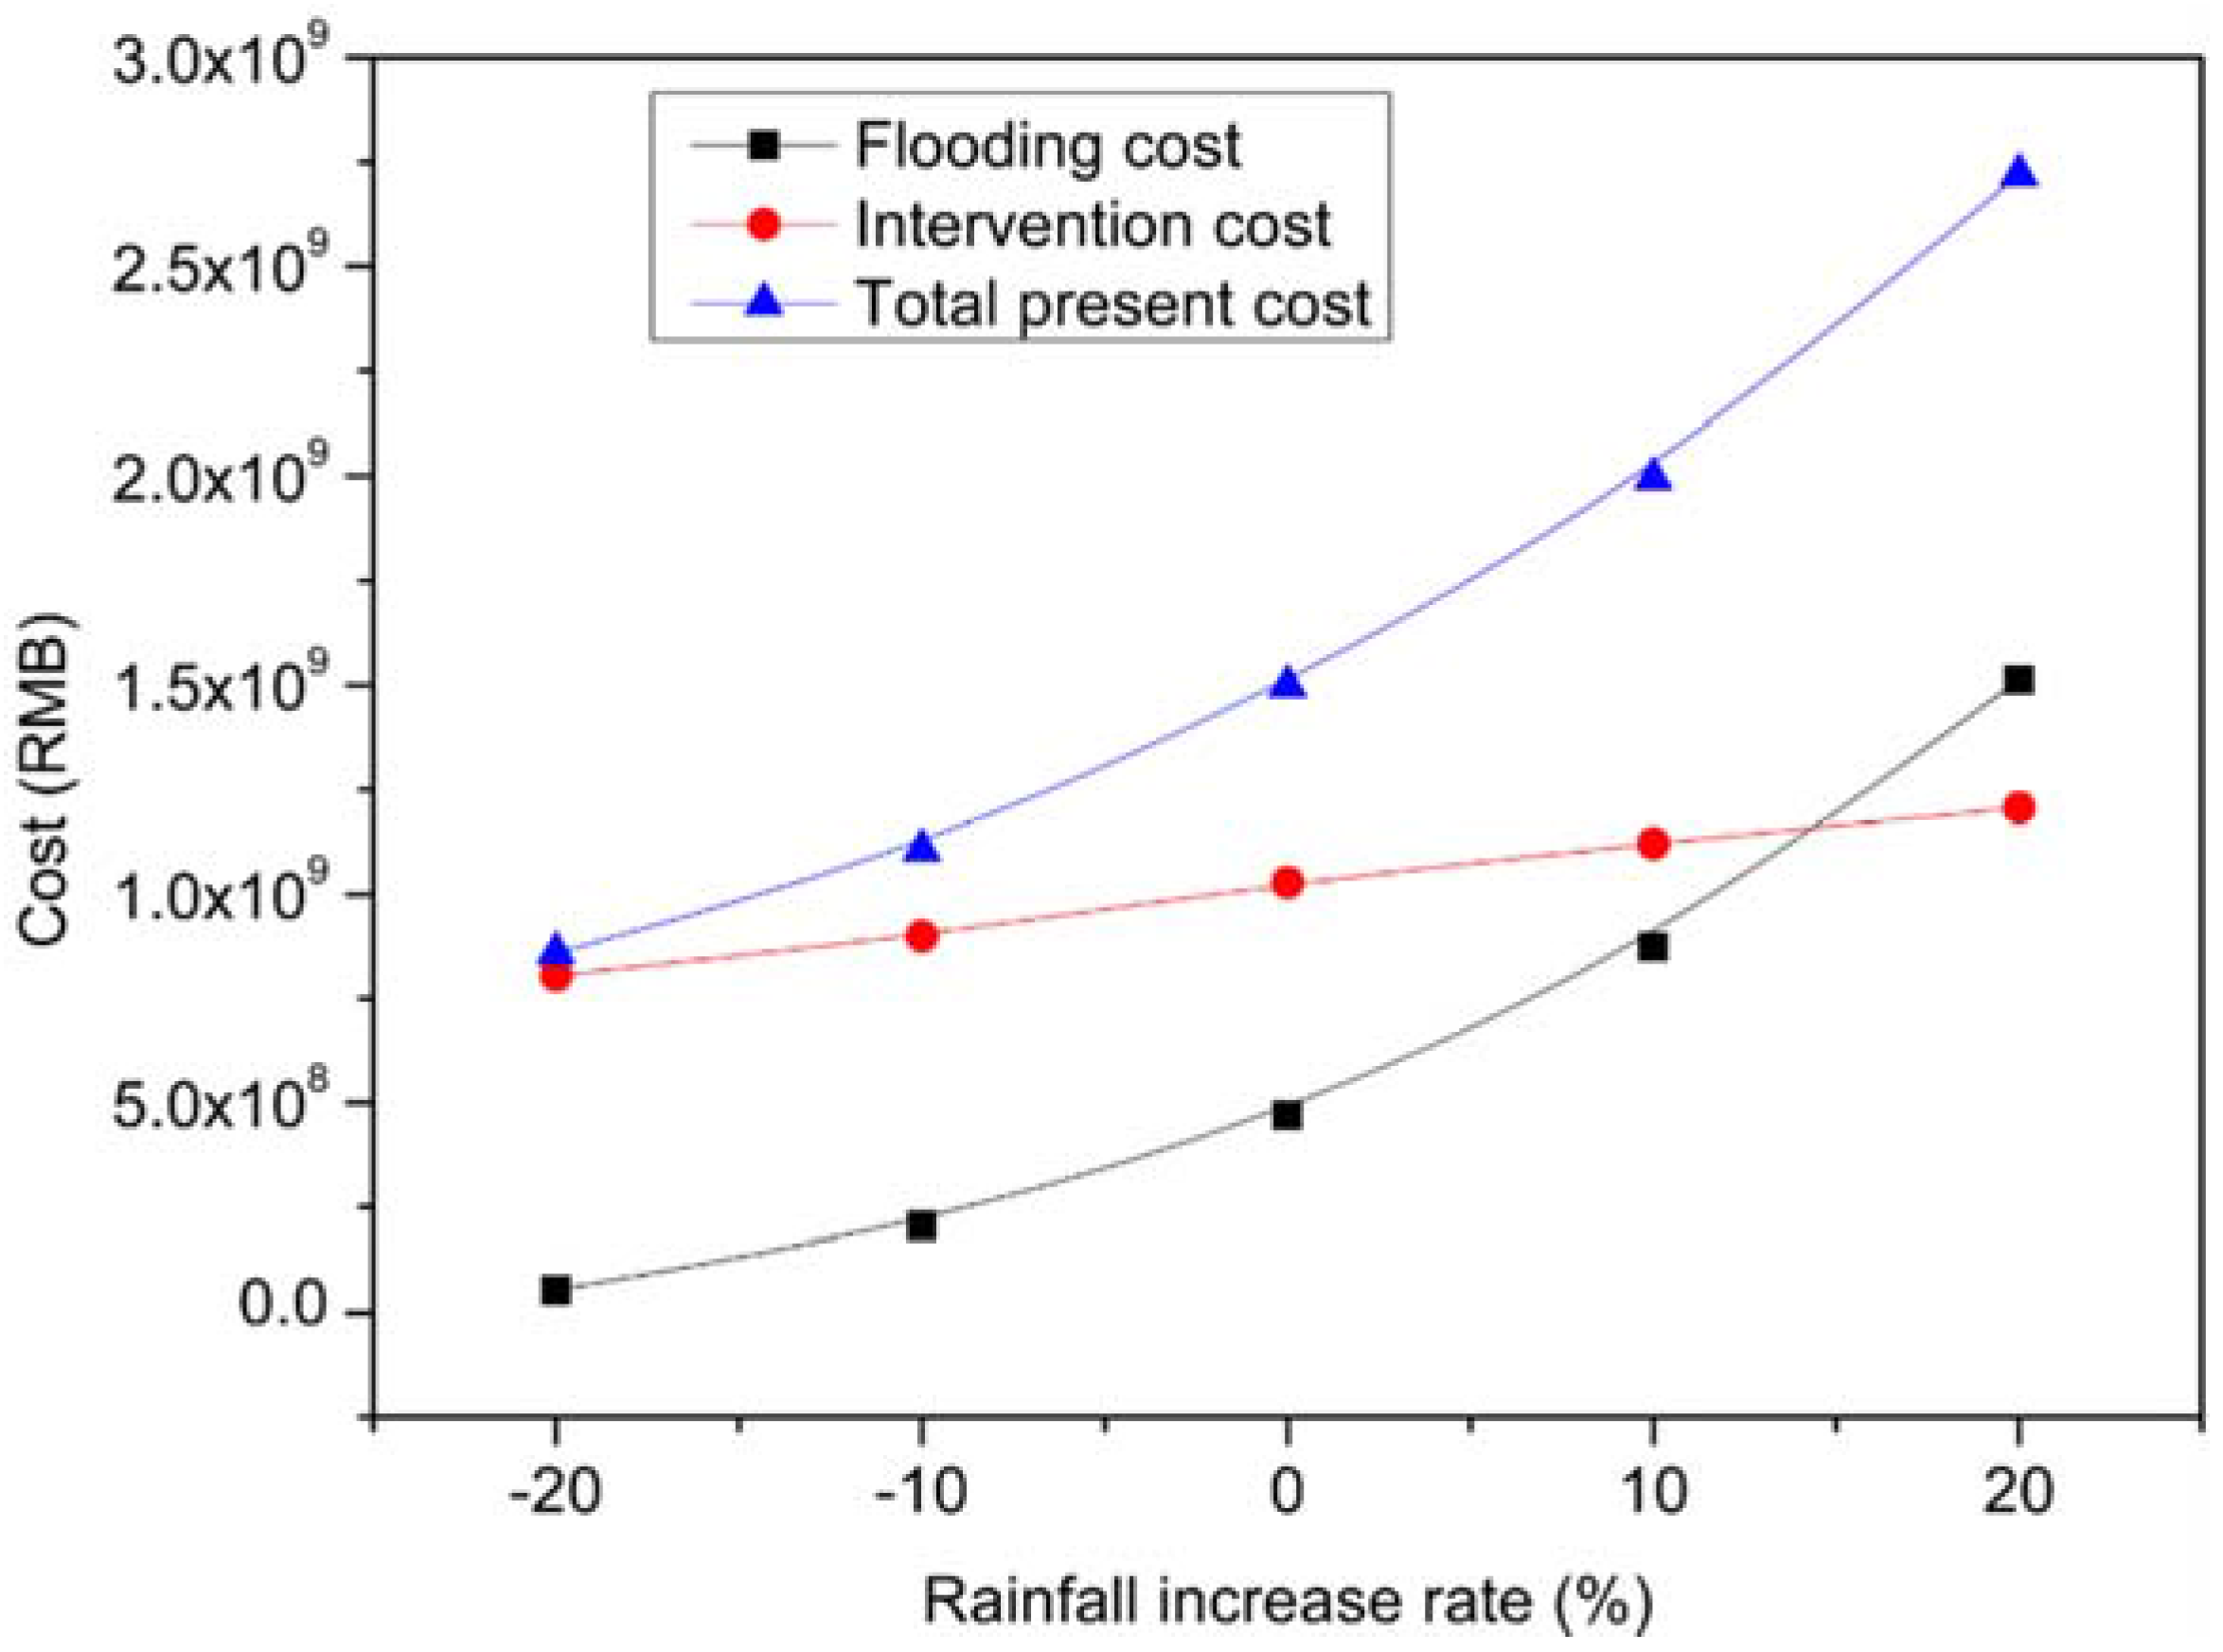
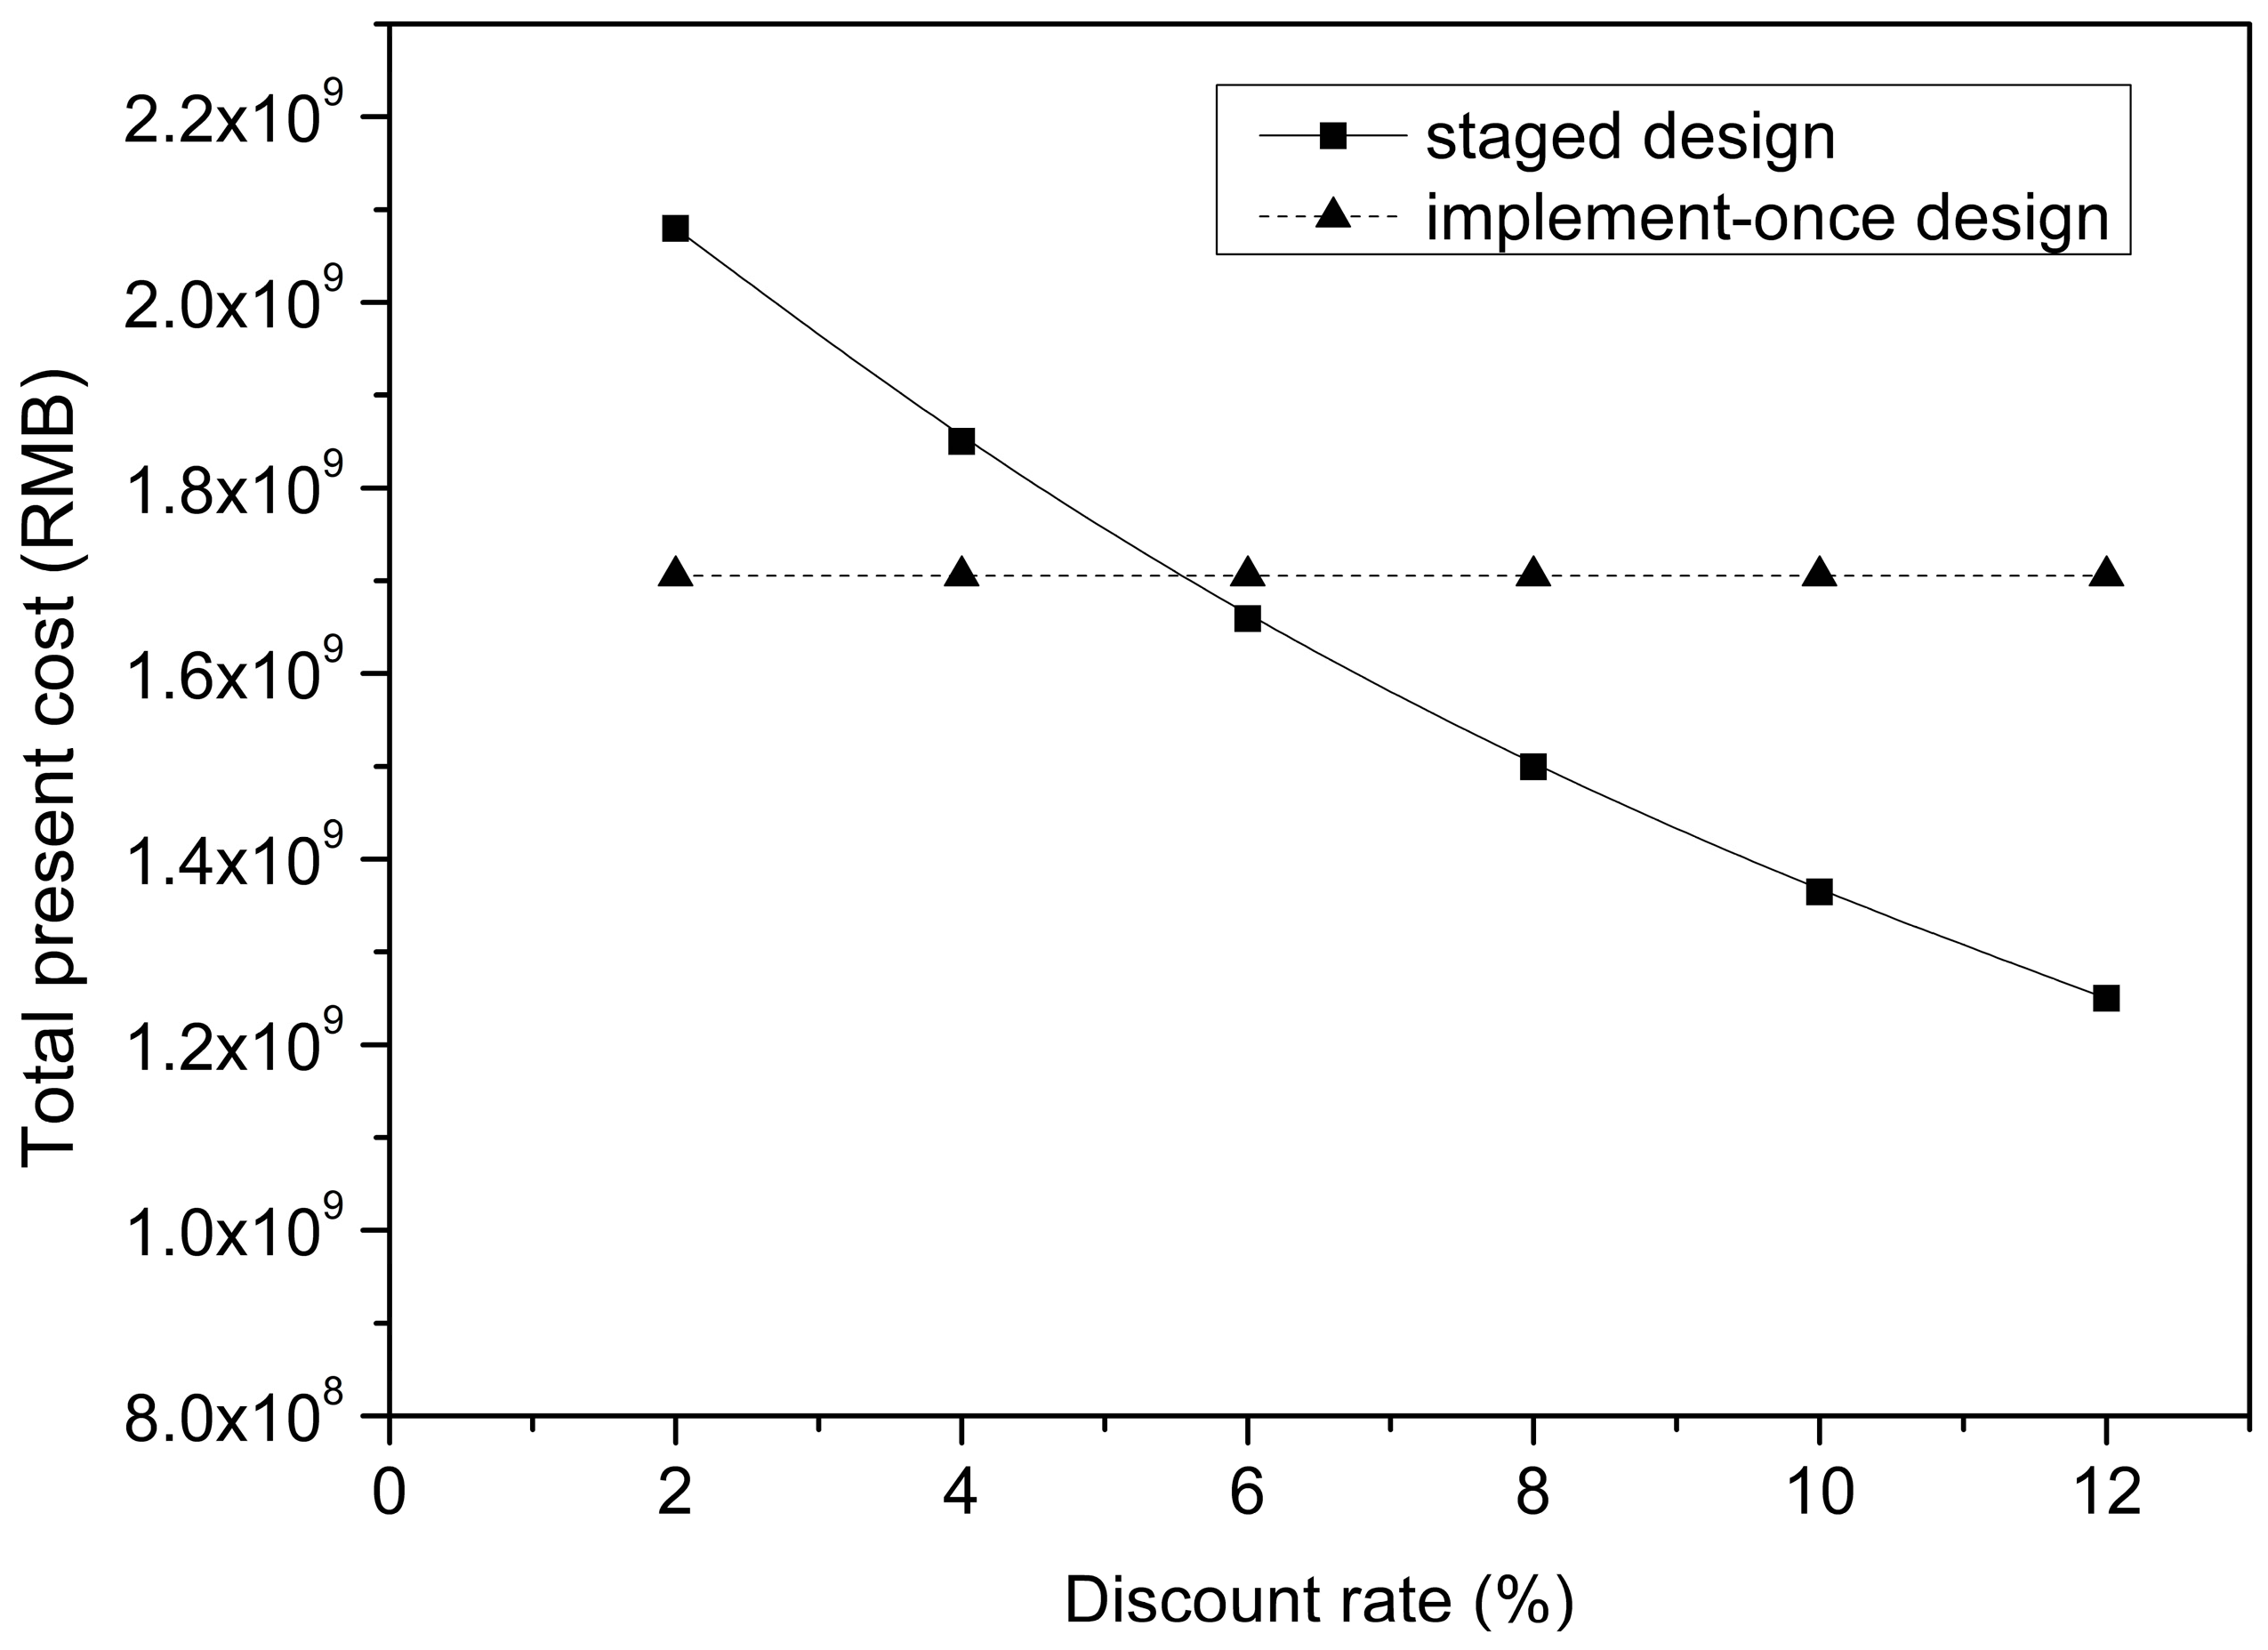
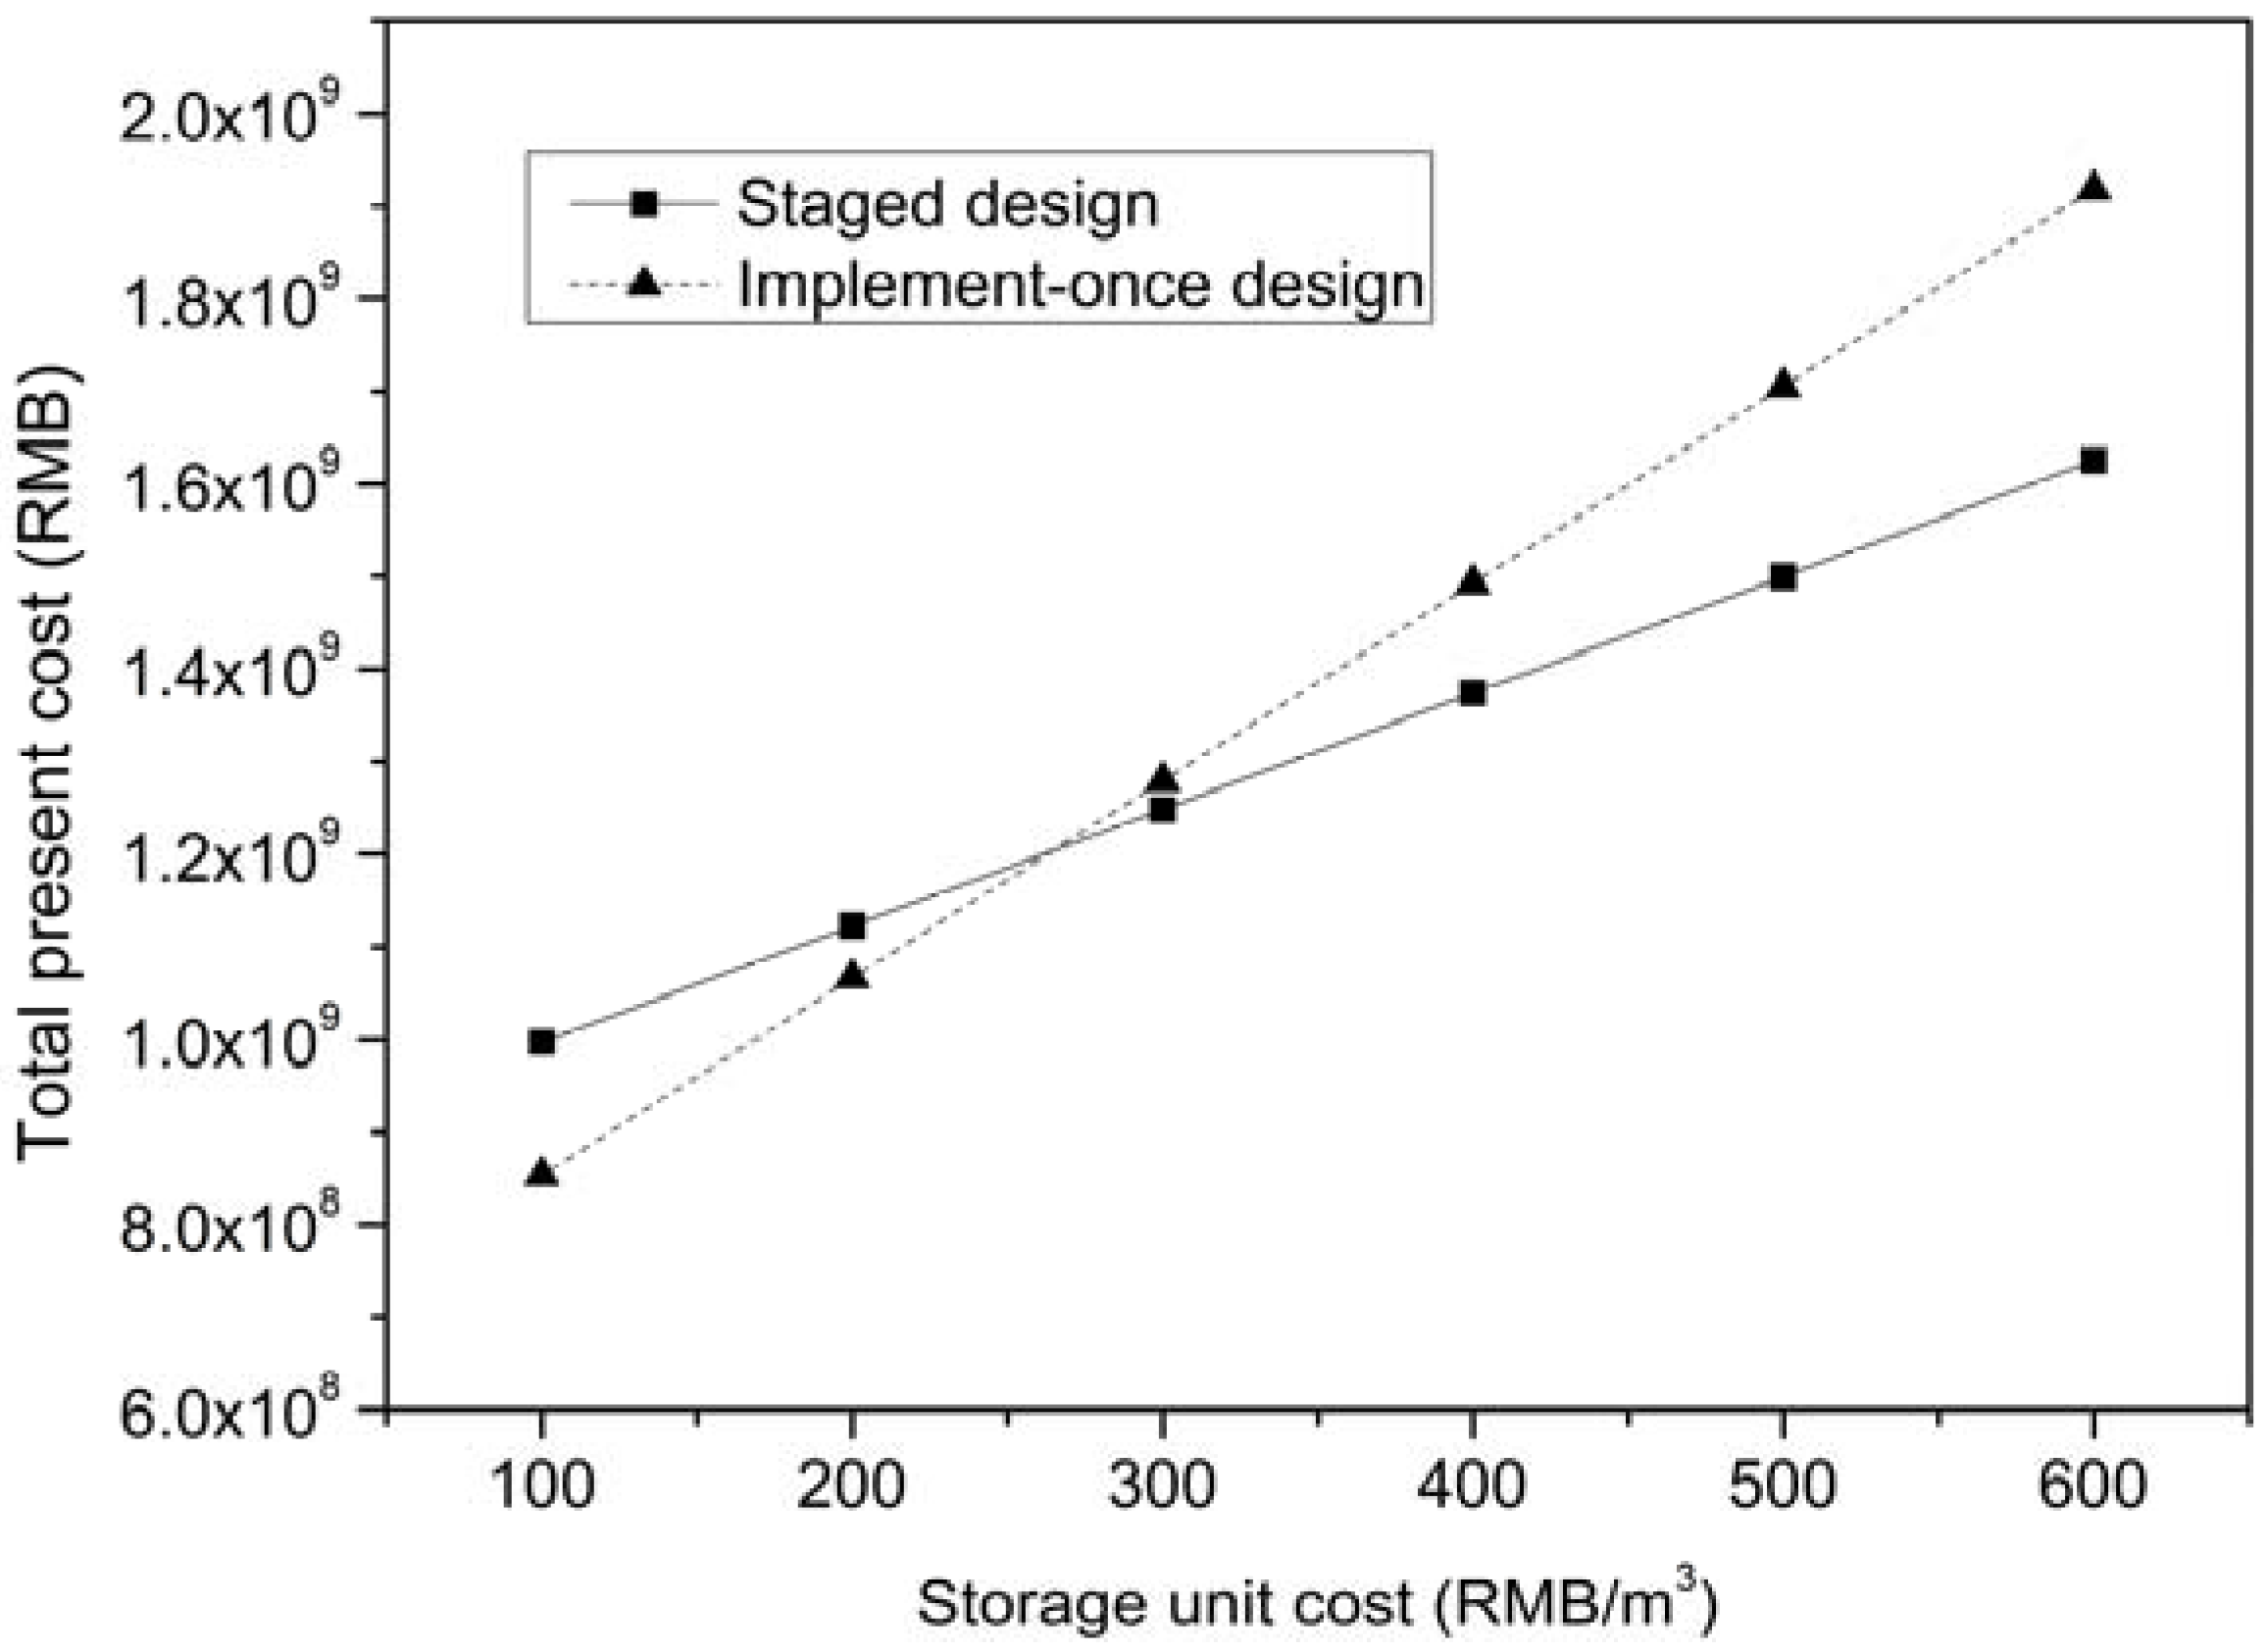
Figure 5 shows that with an increase in the rainfall increase rate, the total present costs and the flooding costs present exponential growth. In contrast, the total present costs have a very rapidly declining curve with an increase in discount rates, as shown in Figure 6. Figure 7 and Figure 8 show that the total present costs are increased linearly with the increase of flood unit costs and storage unit costs. Briefly, the total present costs would change with a specific trend in terms of the data parameters changing, which illustrates that the trends of the model’s features are not influenced by the assumptions.
4. Discussion
For Fuzhou City, the staged design can significantly reduce the total cost and help alleviate financial pressure compared to the implement-once design. Figure 6 and Figure 8 show that cost savings would be higher if the discount rate and storage unit costs increase. The findings of this design method may have important implications and contributions to urban flood management in the cities of developing countries with limited construction investments. This is the most important advantage of using staged optimal design.
Besides, the staged approach is flexible to adapt to environment changing for urban flood management. It allows managers to perfect some schemes made today in terms of more comprehensive information for better decisions at a future date. For example, the measures for flooding preparedness which are adequate during the first 20 years of the implementation of the project may no longer be adequate in the following ten years due to climate change. Thus, a staged increase of the size of drainage facilities, such as detention storage and infiltration ponds, can be implemented as supplemental measures in different stages in the future. Also, if the 24-h design rainfall of the 50-year return period increases rapidly and significantly (e.g., with an increase of 10%) in the coming 15 years, the flood interventions should be implemented as early as possible rather than in a staged design. As shown in Figure 5, the total cost increases by 81.5% with an increase of design rainfall from 0 to 20%. In contrast, while the discount rate increases from 2% to 12%, the total optimal cost would reduce to 60% by staged design, as shown in Figure 6. That means that in this situation the manager should make sure the staged design is fully implemented.
In the case study, a 24-h design rainfall for a 50-year return period is assumed without change for 15 years, as the annual maximum 24 h rainfall had a slight change (increased by 0.11%) per year on average from 1952 to 2014. However, the staged design should be implemented if the change is significant. In this situation the hydrology data and catchment data in each step in the methodology of Figure 1 may be different. Then we should evaluate the changes and estimate the design rainfall with time at each step, and update the new data to optimize the design, or supplement other measures to improve the primary design. Specifically, for example if we evaluate the hydrology data and find that the 24-h design rainfall for the 50-year return period has increased by 5% at the end of the first step, the hydrology data in the second step should be updated. Or we can make some supplements, like more green infrastructures to store the extra floodwater due to climate change in the second step. In brief, the staged design approach can give managers more open options against climate change.
5. Conclusions
China’s State Council urges the 36 largest cities to update their drainage systems to handle a design rainfall of 24 h for a 50-year return period in response to increasing flooding event reports. It would be a massive project with large investments for these cities. We therefore propose a staged cost optimization design for updating urban drainage, which is an effective way to reduce the costs of the project. Also, the staged approach is of significant flexibility to adapt to environmental changes for urban flood management. The staged cost optimization model involves a hydrological and hydrodynamic model developed for the city of Fuzhou, China. This model was established taking into full consideration the constraints of specific local conditions. Analysis of the model’s sensitivities assured that the trends of the model’s features are not influenced by the assumptions and confirmed the applicability and robustness of the developed model and method.
Storage facilities combined with pumps adapted to local situations were recommended to update the drainage system for the whole city. For Fuzhou City, the storage facilities were mainly designed to store the floodwater from surrounding mountain areas which quickly converges on the center plain area during rain events due to the local topography. Meanwhile, the pumping facilities set in the river mouth downstream are mainly designed to drain the floodwater from urban areas. The framework of storage and pumping scales was designed by stage for the urban Fuzhou area, while the location, layout and corresponding forms (like detention tanks and infiltration ponds) need to be studied further based on local planning in future work. Moreover, a comprehensive assessment of uncertainties due to environmental changes in the design of drainage systems should also be carried out in future work.
Acknowledgments
The research was supported by the National Natural Science Foundation of China (51509179), National Key Research and Development Program of China (2016YFC0401903), Tianjin Municipal Natural Science Foundation (17JCQNJC08900), the Program of Introducing Talents of Discipline to Universities (B14012). The authors acknowledge the assistance of anonymous reviewers.
Author Contributions
All authors contributed extensively to the work presented in this paper. Kui Xu and Lingling Bin contributed to conceive and design the study. Kui Xu, Lingling Bin and Jijian Lian contributed the writing of the paper. Lingling Bin and Run Liu provided data and made the final revision of the paper.
Conflicts of Interest
The authors declare no conflict of interest.
References
- Liang, Q.; Smith, L.S. A High-Performance Integrated Hydrodynamic Modelling System for urban flood simulations. J. Hydroinform. 2015, 17, 518–533. [Google Scholar] [CrossRef]
- Kulkarni, A.T.; Eldho, T.I.; Rao, E.P.; Mohan, B.K. An integrated flood inundation model for coastal urban watershed of Navi Mumbai, India. Nat. Hazards 2014, 73, 403–425. [Google Scholar] [CrossRef]
- Zhong, H.; Overloop, P.J.V.; Gelder, P.V.; Rijcken, T. Influence of a Storm Surge Barrier’s Operation on the Flood Frequency in the Rhine Delta Area. Water 2012, 4, 474–493. [Google Scholar] [CrossRef]
- Xu, K.; Ma, C.; Lian, J.; Bin, L. Joint probability analysis of extreme precipitation and storm tide in a coastal city under changing environment. PLoS ONE 2014, 9, e109341. [Google Scholar] [CrossRef] [PubMed]
- Sang, Y.F.; Wang, Z.; Liu, C. What factors are responsible for the Beijing storm? Nat. Hazards 2013, 65, 2399–2400. [Google Scholar] [CrossRef]
- Zheng, Z.; Qi, S.; Xu, Y. Questionable frequent occurrence of urban flood hazards in modern cities of China. Nat. Hazards 2013, 65, 1009–1010. [Google Scholar] [CrossRef]
- Yin, J.; Ye, M.; Yin, Z.; Xu, S. A review of advances in urban flood risk analysis over China. Stoch. Environ. Res. Risk Assess. 2015, 29, 1063–1070. [Google Scholar] [CrossRef]
- Sun, F.; Yang, Z.; Huang, Z. Challenges and Solutions of Urban Hydrology in Beijing. Water Resour. Manag. 2014, 28, 3377–3389. [Google Scholar] [CrossRef]
- Wang, J.B.; Architecture, S.O. Review on Researches about Urban Waterlogging in China. J. Anhui Agric. Sci. 2013, 41, 12072–12078. [Google Scholar]
- Wan, X.P.; Zhu, G.; Ke, L.U. Introduction to Chengdu Central City Drainage System Capacity Upgrade Planning Project. China Water Wastewater 2014, 30, 67–69. [Google Scholar]
- Che, W.; Yang, Z.; Zhao, Y.; Li, J. Analysis of urban flooding control and major and minor drainage systems in China. China Water Wastewater 2013, 29, 13–19. [Google Scholar]
- Rui, X.; Jiang, C. Problems of urban drainage in China. Adv. Sci. Technol. Water Resour. 2013, 33, 1–5. [Google Scholar]
- Oxley, R.L.; Mays, L.W. Optimization—Simulation Model for Detention Basin System Design. Water Resour. Manag. 2014, 28, 1157–1171. [Google Scholar] [CrossRef]
- Song, X.M.; Kong, F.Z.; Zhan, C.S.; Han, J.W. A Hybrid Optimization Rainfall-Runoff Simulation Based on Xinanjiang Model and Artificial Neural Network. J. Hydrol. Eng. 2012, 17, 1033–1041. [Google Scholar] [CrossRef]
- Guo, Y.; Adams, B.J. An analytical probabilistic approach to sizing flood control detention facilities. Water Resour. Res. 1999, 35, 2457–2468. [Google Scholar] [CrossRef]
- Zhang, W.; Li, T. The Influence of Objective Function and Acceptability Threshold on Uncertainty Assessment of an Urban Drainage Hydraulic Model with Generalized Likelihood Uncertainty Estimation Methodology. Water Resour. Manag. 2015, 29, 2059–2072. [Google Scholar] [CrossRef]
- Yazdi, J.; Lee, E.H.; Kim, J.H. Stochastic Multiobjective Optimization Model for Urban Drainage Network Rehabilitation. J. Water Res. Plan. Manag. 2015, 141, 4014091. [Google Scholar] [CrossRef]
- Tao, T.; Wang, J.; Xin, K.; Li, S. Multi-objective optimal layout of distributed storm-water detention. Int. J. Environ. Sci. Technol. 2014, 11, 1473–1480. [Google Scholar] [CrossRef]
- Duan, H.F.; Li, F.; Tao, T. Multi-objective Optimal Design of Detention Tanks in the Urban Stormwater Drainage System: Uncertainty and Sensitivity Analysis. Water Resour. Manag. 2016, 30, 2213–2226. [Google Scholar] [CrossRef]
- Li, F.; Duan, H.F.; Yan, H.; Tao, T. Multi-Objective Optimal Design of Detention Tanks in the Urban Stormwater Drainage System: Framework Development and Case Study. Water Resour. Manag. 2015, 29, 2125–2137. [Google Scholar] [CrossRef]
- Abdellatif, M.; Atherton, W.; Alkhaddar, R.; Osman, Y. Flood risk assessment for urban water system in a changing climate using artificial neural network. Nat. Hazards 2015, 79, 1059–1077. [Google Scholar] [CrossRef]
- Zheng, F.; Leonard, M.; Westra, S. Application of the design variable method to estimate coastal flood risk. J. Flood Risk Manag. 2015. [Google Scholar] [CrossRef]
- Zope, P.E.; Eldho, T.I.; Jothiprakash, V. Impacts of urbanization on flooding of a coastal urban catchment: A case study of Mumbai City, India. Nat. Hazards 2015, 75, 887–908. [Google Scholar] [CrossRef]
- Mailhot, A.; Duchesne, S. Design Criteria of Urban Drainage Infrastructures under Climate Change. J. Water Resour. Plan. Manag. 2010, 136, 201–208. [Google Scholar] [CrossRef]
- Vojinovic, Z.; Sahlu, S.; Torres, A.S.; Seyoum, S.D.; Anvarifar, F.; Matungulu, H.; Barreto, W.; Savic, D.; Kapelan, Z. Multi-objective rehabilitation of urban drainage systems under uncertainties. J. Hydroinform. 2014, 16, 1044–1061. [Google Scholar] [CrossRef]
- Gersonius, B.; Ashley, R.; Pathirana, A.; Zevenbergen, C. Climate change uncertainty: Building flexibility into water and flood risk infrastructure. Clim. Chang. 2013, 116, 411–423. [Google Scholar] [CrossRef]
- Löwe, R.; Urich, C.; Sto. Domingo, N.; Mark, O.; Deletic, A.; Arnbjerg-Nielsen, K. Assessment of urban pluvial flood risk and efficiency of adaptation options through simulations—A new generation of urban planning tools. J. Hydrol. 2017, 550, 355–367. [Google Scholar]
- Maharjan, M.; Pathirana, A.; Gersonius, B.; Vairavamoorthy, K. Staged cost optimization of urban storm drainage systems based on hydraulic performance in a changing environment. Hydrol. Earth Syst. Sci. 2009, 13, 481–489. [Google Scholar] [CrossRef]
- Lian, J.J.; Xu, K.; Ma, C. Joint impact of rainfall and tidal level on flood risk in a coastal city with a complex river network: A case study of Fuzhou City, China. Hydrol. Earth Syst. Sci. 2013, 17, 679–689. [Google Scholar] [CrossRef]
- Mguni, P.; Herslund, L.; Jensen, M.B. Sustainable urban drainage systems: Examining the potential for green infrastructure-based stormwater management for Sub-Saharan cities. Nat. Hazards 2016, 82, 241–257. [Google Scholar] [CrossRef]
- Ramos, H.M.; Teyssier, C.; López-Jiménez, P.A. Optimization of Retention Ponds to Improve the Drainage System Elasticity for Water-Energy Nexus. Water Resour. Manag. 2013, 27, 2889–2901. [Google Scholar] [CrossRef]
- DHI. MIKE FLOOD 1D-2D Modeling, User Manual; DHI: Hørsholm, Denmark, 2011. [Google Scholar]
- Rossman, L.A. Storm Water Management Model User’s Manual; U.S. Environmental Protection Agency: Cincinnaty, OH, USA, 2015.
- Brunner, G.W. Hec-Ras River Analysis System: User’s Manual; US Army Corps of Engineers, Institute for Water Resources, Hydrologic Engineering Center: Davis, CA, USA, 2001. [Google Scholar]
- Ren-Jun, Z. The Xinanjiang model applied in China. J. Hydrol. 1992, 135, 371–381. [Google Scholar] [CrossRef]
- Guo, J. Rational hydrograph method for small urban watersheds. J. Hydrol. Eng. 2001, 6, 352–356. [Google Scholar] [CrossRef]
- Saltelli, A.; Ratto, M.; Andres, T.; Campolongo, F.; Cariboni, J.; Gatelli, D.; Saisana, M.; Tarantola, S. Global Sensitivity Analysis; John Wiley & Sons: Hoboken, NJ, USA, 2008; Volume 7, pp. 183–206. [Google Scholar]
Figure 1.
Diagram of a staged optimization model.

Figure 2.
Location map of the study area and its terrain map.

Figure 3.
Hydrodynamic model of drainage system in Fuzhou urban area.

Figure 4.
Results comparison between staged design and implement-once design.

Figure 5.
Cost sensitivity to the rainfall increase rate.

Figure 6.
Cost sensitivity to the discount rate.

Figure 7.
Cost sensitivity to the flood unit cost.

Figure 8.
Cost sensitivity to the storage unit cost.


Table 1.
Runoff volumes of 24 h rainfall for different return periods.
| Return Period (Years) | 24-h Rainfall (mm) | Runoff Volume from Urban Areas (103 m3) | Runoff Volume from Mountain Areas (103 m3) |
|---|---|---|---|
| 2 | 112.5 | 4663.5 | 2125.8 |
| 5 | 143.4 | 6076.9 | 2602.3 |
| 10 | 169.8 | 7088.2 | 3257.1 |
| 20 | 194.6 | 8006.1 | 3894.9 |
| 50 | 226.1 | 9151.8 | 4730.8 |
Table 2.
Optimal storage and pumping scales for construction at different stages.
| Time Steps j | Staged (Years) | SV (103 m3) | PV (m3/s) |
|---|---|---|---|
| 1 | 1–3 | 420 | 45 |
| 2 | 4–6 | 420 | 45 |
| 3 | 7–9 | 430 | 45 |
| 4 | 10–12 | 430 | 46 |
| 5 | 13–15 | 430 | 46 |
© 2018 by the authors. Licensee MDPI, Basel, Switzerland. This article is an open access article distributed under the terms and conditions of the Creative Commons Attribution (CC BY) license (http://creativecommons.org/licenses/by/4.0/).
Share and Cite
MDPI and ACS Style
Xu, K.; Bin, L.; Lian, J.; Liu, R. Staged Optimization Design for Updating Urban Drainage Systems in a City of China. Water 2018, 10, 66. https://doi.org/10.3390/w10010066
AMA Style
Xu K, Bin L, Lian J, Liu R. Staged Optimization Design for Updating Urban Drainage Systems in a City of China. Water. 2018; 10(1):66. https://doi.org/10.3390/w10010066
Chicago/Turabian StyleXu, Kui, Lingling Bin, Jijian Lian, and Run Liu. 2018. "Staged Optimization Design for Updating Urban Drainage Systems in a City of China" Water 10, no. 1: 66. https://doi.org/10.3390/w10010066
Note that from the first issue of 2016, this journal uses article numbers instead of page numbers. See further details here.