Application of ENSO and Drought Indices for Water Level Reconstruction and Prediction: A Case Study in the Lower Mekong River Estuary


1
School of Geodesy and Geomatics, Wuhan University, Wuhan 430079, China
2
Institute of Marine Science and Technology, Wuhan University, Wuhan 430079, China
3
Department of Geography, Hong Kong Baptist University, Hong Kong, China
4
State Key Laboratory of Geodesy and Earth’s Dynamics, Institute of Geodesy and Geophysics, Chinese Academy of Sciences, Wuhan 430077, China
5
School of Environment and Sustainability, University of Saskatchewan, Saskatoon, SK S7N 3H5, Canada
*
Authors to whom correspondence should be addressed.
Water 2018, 10(1), 58; https://doi.org/10.3390/w10010058
Submission received: 19 October 2017
/
Revised: 22 December 2017
/
Accepted: 9 January 2018
/
Published: 11 January 2018
(This article belongs to the Special Issue Impact of Climate on Hydrological Extremes)
Abstract
:Water level monitoring is important for understanding the global hydrological cycle. Remotely-sensed indices that capture localized instantaneous responses have been extensively explored for water level reconstruction during the past two decades. However, the potential usage of the Palmer’s Drought Severity Index (PDSI) and El Niño Southern Oscillation (ENSO) indices for water level reconstruction and prediction has not been explored. This paper examines the relationship between observed water level and PDSI based on a soil-moisture water balance model and three ENSO indices for the lower Mekong River estuary on a monthly temporal scale. We found that the time-lagged information between the standardized water level and the ENSO indices that enabled us to reconstruct the water level using the ENSO indices. The influence of strong ENSO events on the water level can help capture the hydrological extremes during the period. As a result, PDSI-based water level reconstruction can be further improved with the assistance of ENSO information (called ENSO-assisted PDSI) during ENSO events. The water level reconstructed from the PDSI and ENSO indices (and that of remote sensing) compared to observed water level shows a correlation coefficient of around 0.95 (and <0.90), with an RMS error ranging from 0.23 to 0.42 m (and 0.40 to 0.79 m) and an NSE around 0.90 (and <0.81), respectively. An external assessment also displayed similar results. This indicates that the usage of ENSO information could lead to a potential improvement in water level reconstruction and prediction for river basins affected by the ENSO phenomenon and hydrological extremes.
1. Introduction
Water resources, including fresh water supply, hydrological extremes and agricultural irrigation, is critical for human sustainability in the near future [1,2]. With the increasing demand for water resources, it is more and more important to monitor the water volume in rivers, lakes, reservoirs and wetlands [3]. Traditionally, the water level (or stage) is one of the basic hydraulic variables measured along river reaches and estuary mouths. It is a useful information for understanding local water variability. It is also essential for monitoring hydrological extremes (including floods and droughts) that cause agricultural and economic losses [4]. Therefore, continuous, accurate, and timely water level monitoring for an early alert regarding hydrological extremes is essential [5].
Due to insufficient funds for ground-based station maintenance [6,7], and globally unevenly distributed and sparsely-gauged stations, an alternative that can provide continuous direct or indirect measurements has to be sought. Owing to the ability to record localized instantaneous land surface or surface water responses with synoptic spatial coverage, both passive and active remote sensing have been recently investigated for water level reconstruction since the 1990s (e.g., [8,9,10]), particularly in sparsely-gauged or ungauged remote regions [5,11]. Yet, in addition to the low temporal resolution for some remote sensing satellites when compared to in-situ data [12,13], the presence of a number of uncertainty sources hinders accurate predictions [3]. Besides, to the best of our up-to-date knowledge, no studies investigate the potential usage of the PDSI and ENSO indices for water level reconstruction and prediction.
In essence, the available causal information can better reconstruct and predict the observed water level, when compared to the localized instantaneous responses from remote sensing. The instantaneous responses only represent the localized information (e.g., precipitation, soil moisture and land surface temperature) within a hydrological cycle, which may contain some noises that may cause the causal information to be unclear. This can be one of the reasons for the relatively less accurate water level estimations based on remote sensing data. Hence, indices that are able to capture the relative amount of water entering (i.e., precipitation), leaving (i.e., evaporation or evapotranspiration), and retaining (i.e., water storage) in the river system, can potentially be better predictors of water level variation than remote sensing methods. Hydrological drought indices (e.g., Palmer’s Drought Severity Index (PDSI) based on a soil-moisture water balance model) [14] can capture the relative dryness of a river system that can relate to the river discharge or water level variation, to some extent. Meanwhile, El Niño Southern Oscillation (ENSO) is one of the most significant events that can affect the precipitation, evaporation or evapotranspiration, and eventually the water level or discharge [15,16,17,18,19]. The ability to capture the water entering, leaving and retaining as a result of an ENSO event and PDSI makes them excellent predictors of water level reconstruction. PDSI captures the drought pattern (e.g., [20,21,22]) and the ENSO event governs the precipitation pattern (e.g., [23,24,25,26,27]), respectively.
Several studies have been conducted to analyze the relationship between ENSO events and the hydrological conditions in the Mekong River Basin for the past, present, and future. The main findings are that the ENSO events have a significant influence on precipitation [15], discharge [16,17], evaporation [18], water levels [19] and snow accumulation and melting [28] in the Mekong River Basin. As a result, the Mekong River Basin is vulnerable to droughts (e.g., 1992, 1993, 1998, 1999 and 2003–2005) and floods (e.g., 2000–2002 and 2011) [29], in which drought indices (e.g., PDSI and the Standardized Precipitation Index (SPI)) were usually employed to assess and project hydrological conditions for the past [30], the present [31], and the future [32].
Though the above relationship between ENSO events (or PDSI) and hydrological conditions in the Mekong basin has been scientifically investigated, a practical usage of this relationship yielding accurate and timely water level projections is sought for pre-disaster alerts. This study aims to investigate the methodology for reconstructing water levels based on the hydrological drought index (i.e., PDSI) and ENSO indices and their combination in the lower Mekong River Basin, where it is mainly controlled by the alternating wet and dry seasons in the front of the South China Sea, making it an ideal experimental region for this study. The constructed relationship is then applied to predict the water level at another in-situ station in the Mekong River mouth, serving as an external validation for our developed methodology, in terms of the Pearson correlation coefficient (PCC), root-mean-square error (RMSE), and the Nash–Sutcliffe model efficiency coefficient (NSE). The commonly available remotely-sensed data (i.e., Normalized Difference Vegetation Index (NDVI) [33] and Land Surface Temperature (LST) [34]) are included as baseline predictors for a comparative analysis with the PDSI and ENSO indices employed in this study.
2. Mekong River Basin and Data Description
2.1. The Geographic Setting of the Mekong River Basin
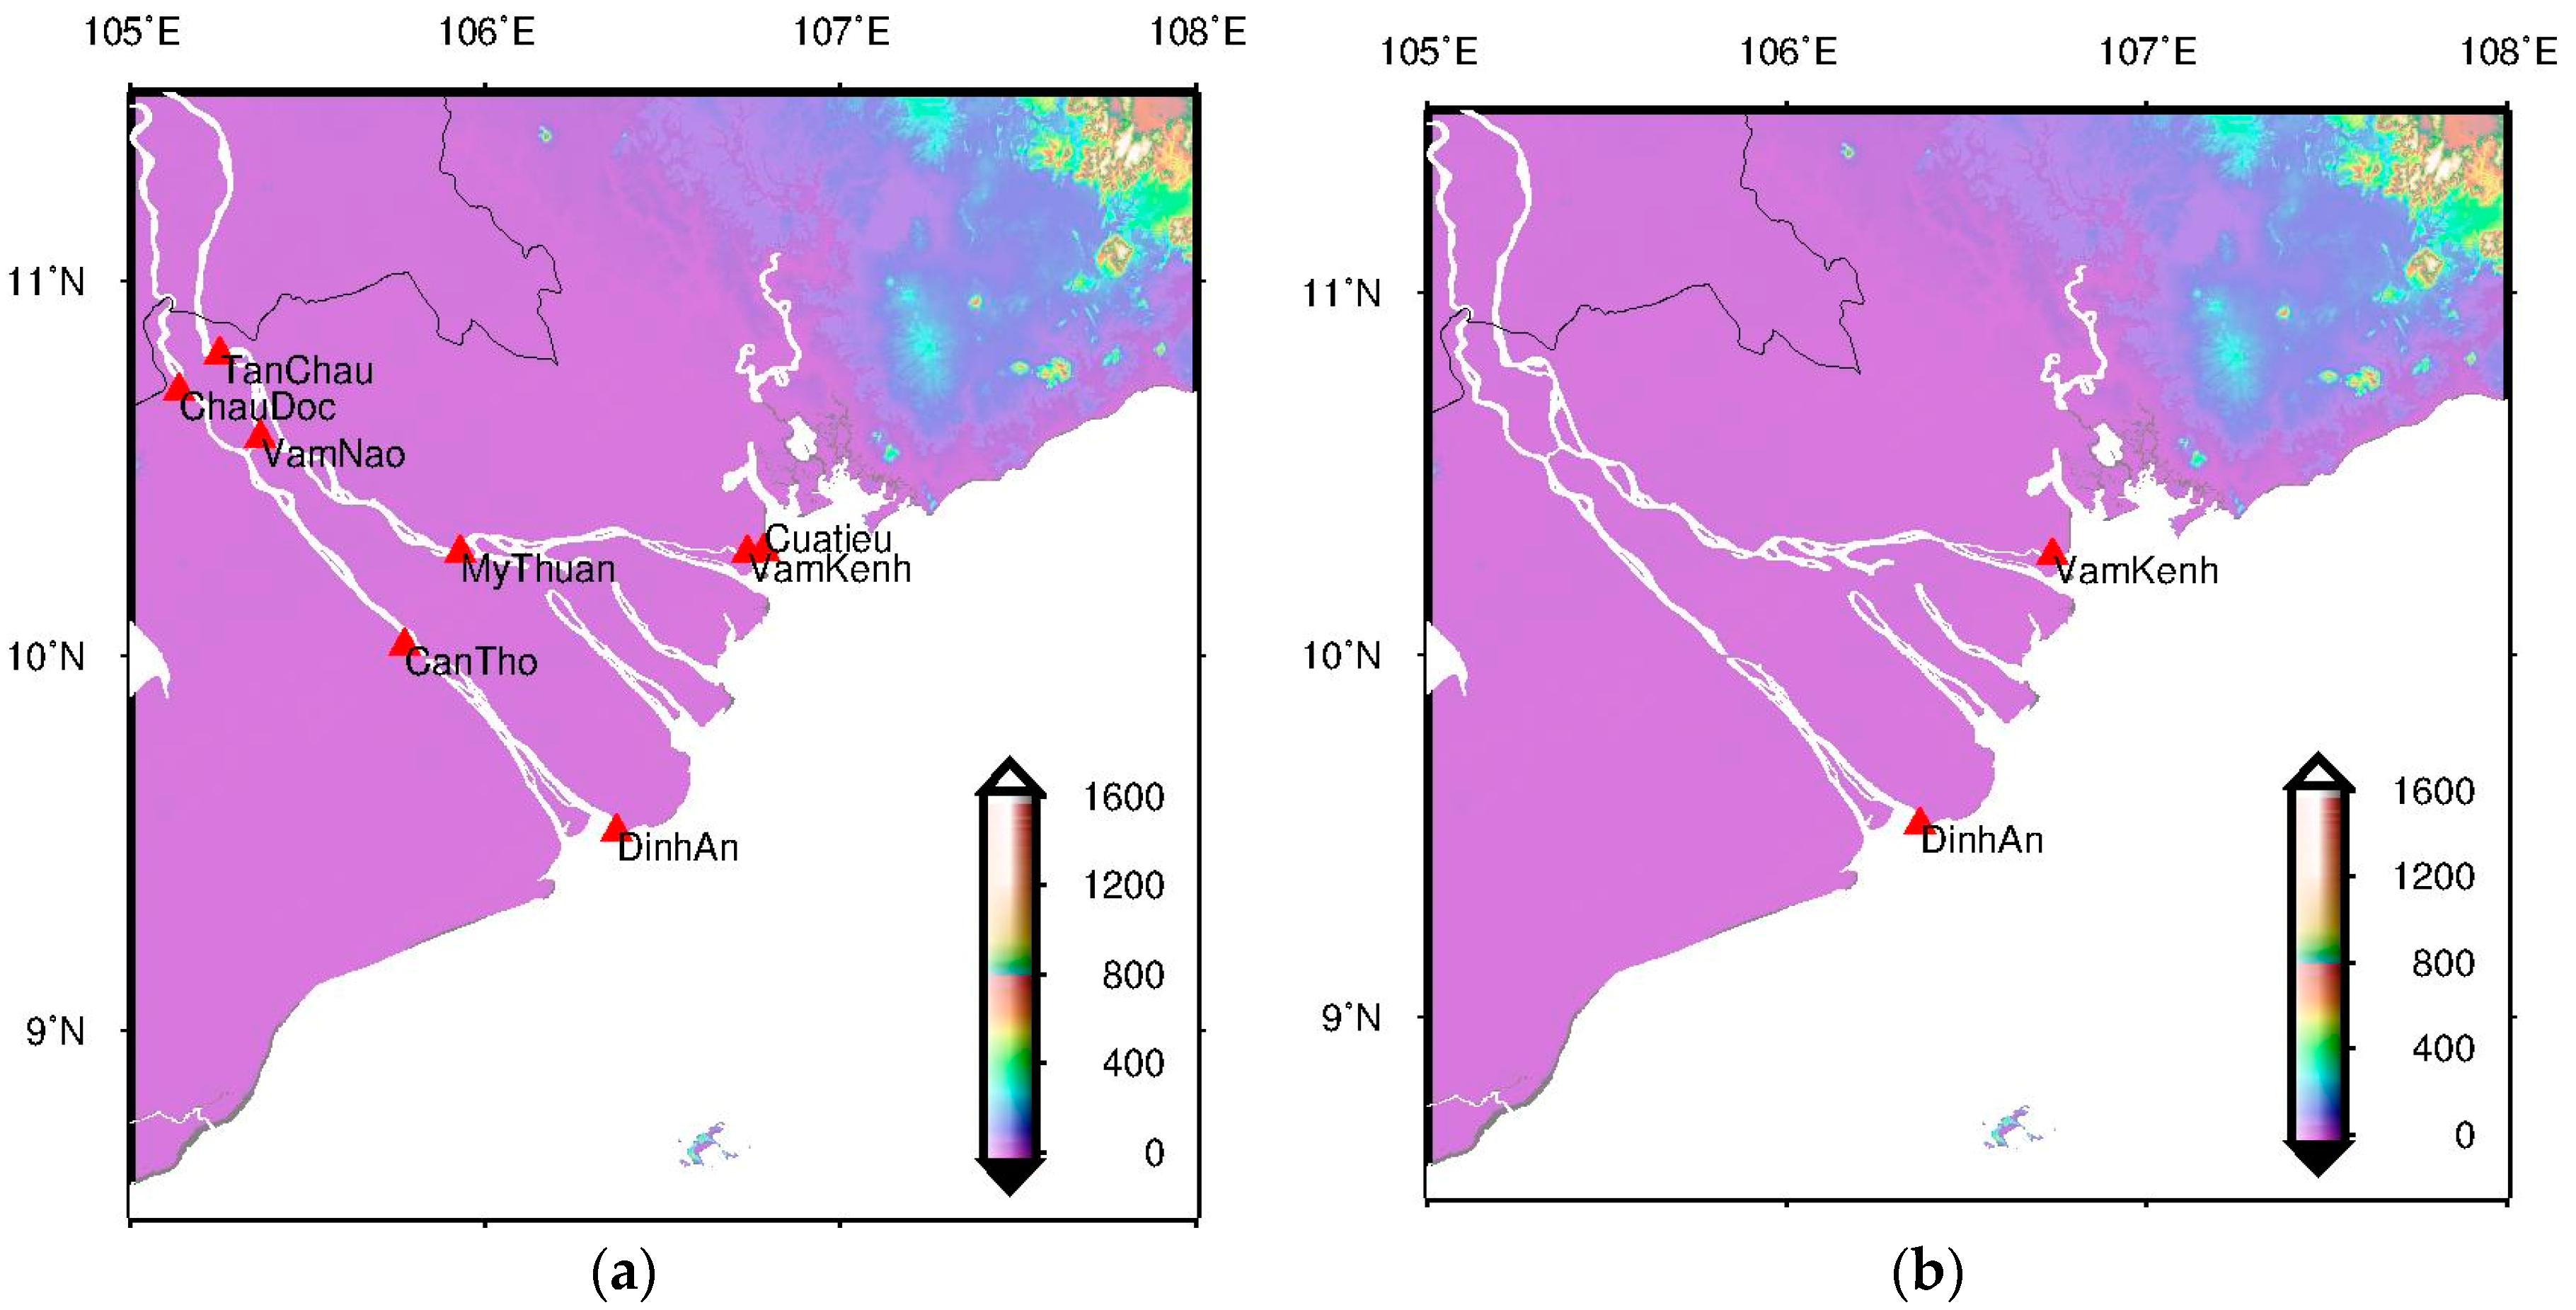
The Mekong River Basin, one of the largest river basins of the world, represents the largest basin in Southeast Asia, draining an area of 795,000 km2 with a total length of 4800 km. It is inhabited by 65 million people [35]. The three-rivers region (TRR), located on the southeastern Qinghai–Tibet Plateau, is its headwater source, with water flowing through parts of southern China, Burma, Laos, Thailand, Cambodia and Vietnam before discharging into the South China Sea. The Mekong River is divided into the Tonle Sap river, the Bassac river and the lower Mekong at Phnom Penh, Cambodia. Before reaching the ocean, the main river is subdivided into several branches. The lower Mekong River Basin is relatively flat (Figure 1).
The hydrological regime of the Mekong River Basin is mainly controlled by the monsoon winds blowing northeast or southwest depending on the season. The southwest monsoon from the ocean corresponds to the rainy season occurring between May and October each year, with a peak in September [35]. Therefore, the water level of Mekong basin begins rising and changing abruptly in May in the eastern and northern highland of the Mekong basin. The highest water level is attained in August or September upstream and as late as in October downstream. The rainy seasons contribute more than 85% of the annual rainfall [36]. Meanwhile, November to March of each year corresponds to dry seasons affected by the northeast monsoon from the mainland, which have less rainfall [35]. The water level of the Mekong basin is the lowest in April. Note that the water within the Mekong River mainly comes from the rainfall in its downstream watershed. The water volume changes depending on the rainfall caused by the monsoons.
In essence, various studies have demonstrated that significant interaction between the Asian monsoon and ENSO exists [37,38]. For instance, ENSO can weaken the East Asian summer monsoon over northern China and Japan [39,40,41]. The South Asian summer monsoon is positively correlated with the tropical Pacific trade winds, which can affect ENSO events [42]. A close relationship between the monsoon and discharge in the lower Mekong basin indicates the presence of a teleconnection between the Mekong River discharge and ENSO [43]. Therefore, the reconstruction of water levels based on the ENSO information is possible in the lower Mekong River Basin, as shown in Section 4.
2.2. Ground-Based, In-Situ Data and Remote Sensing Observations
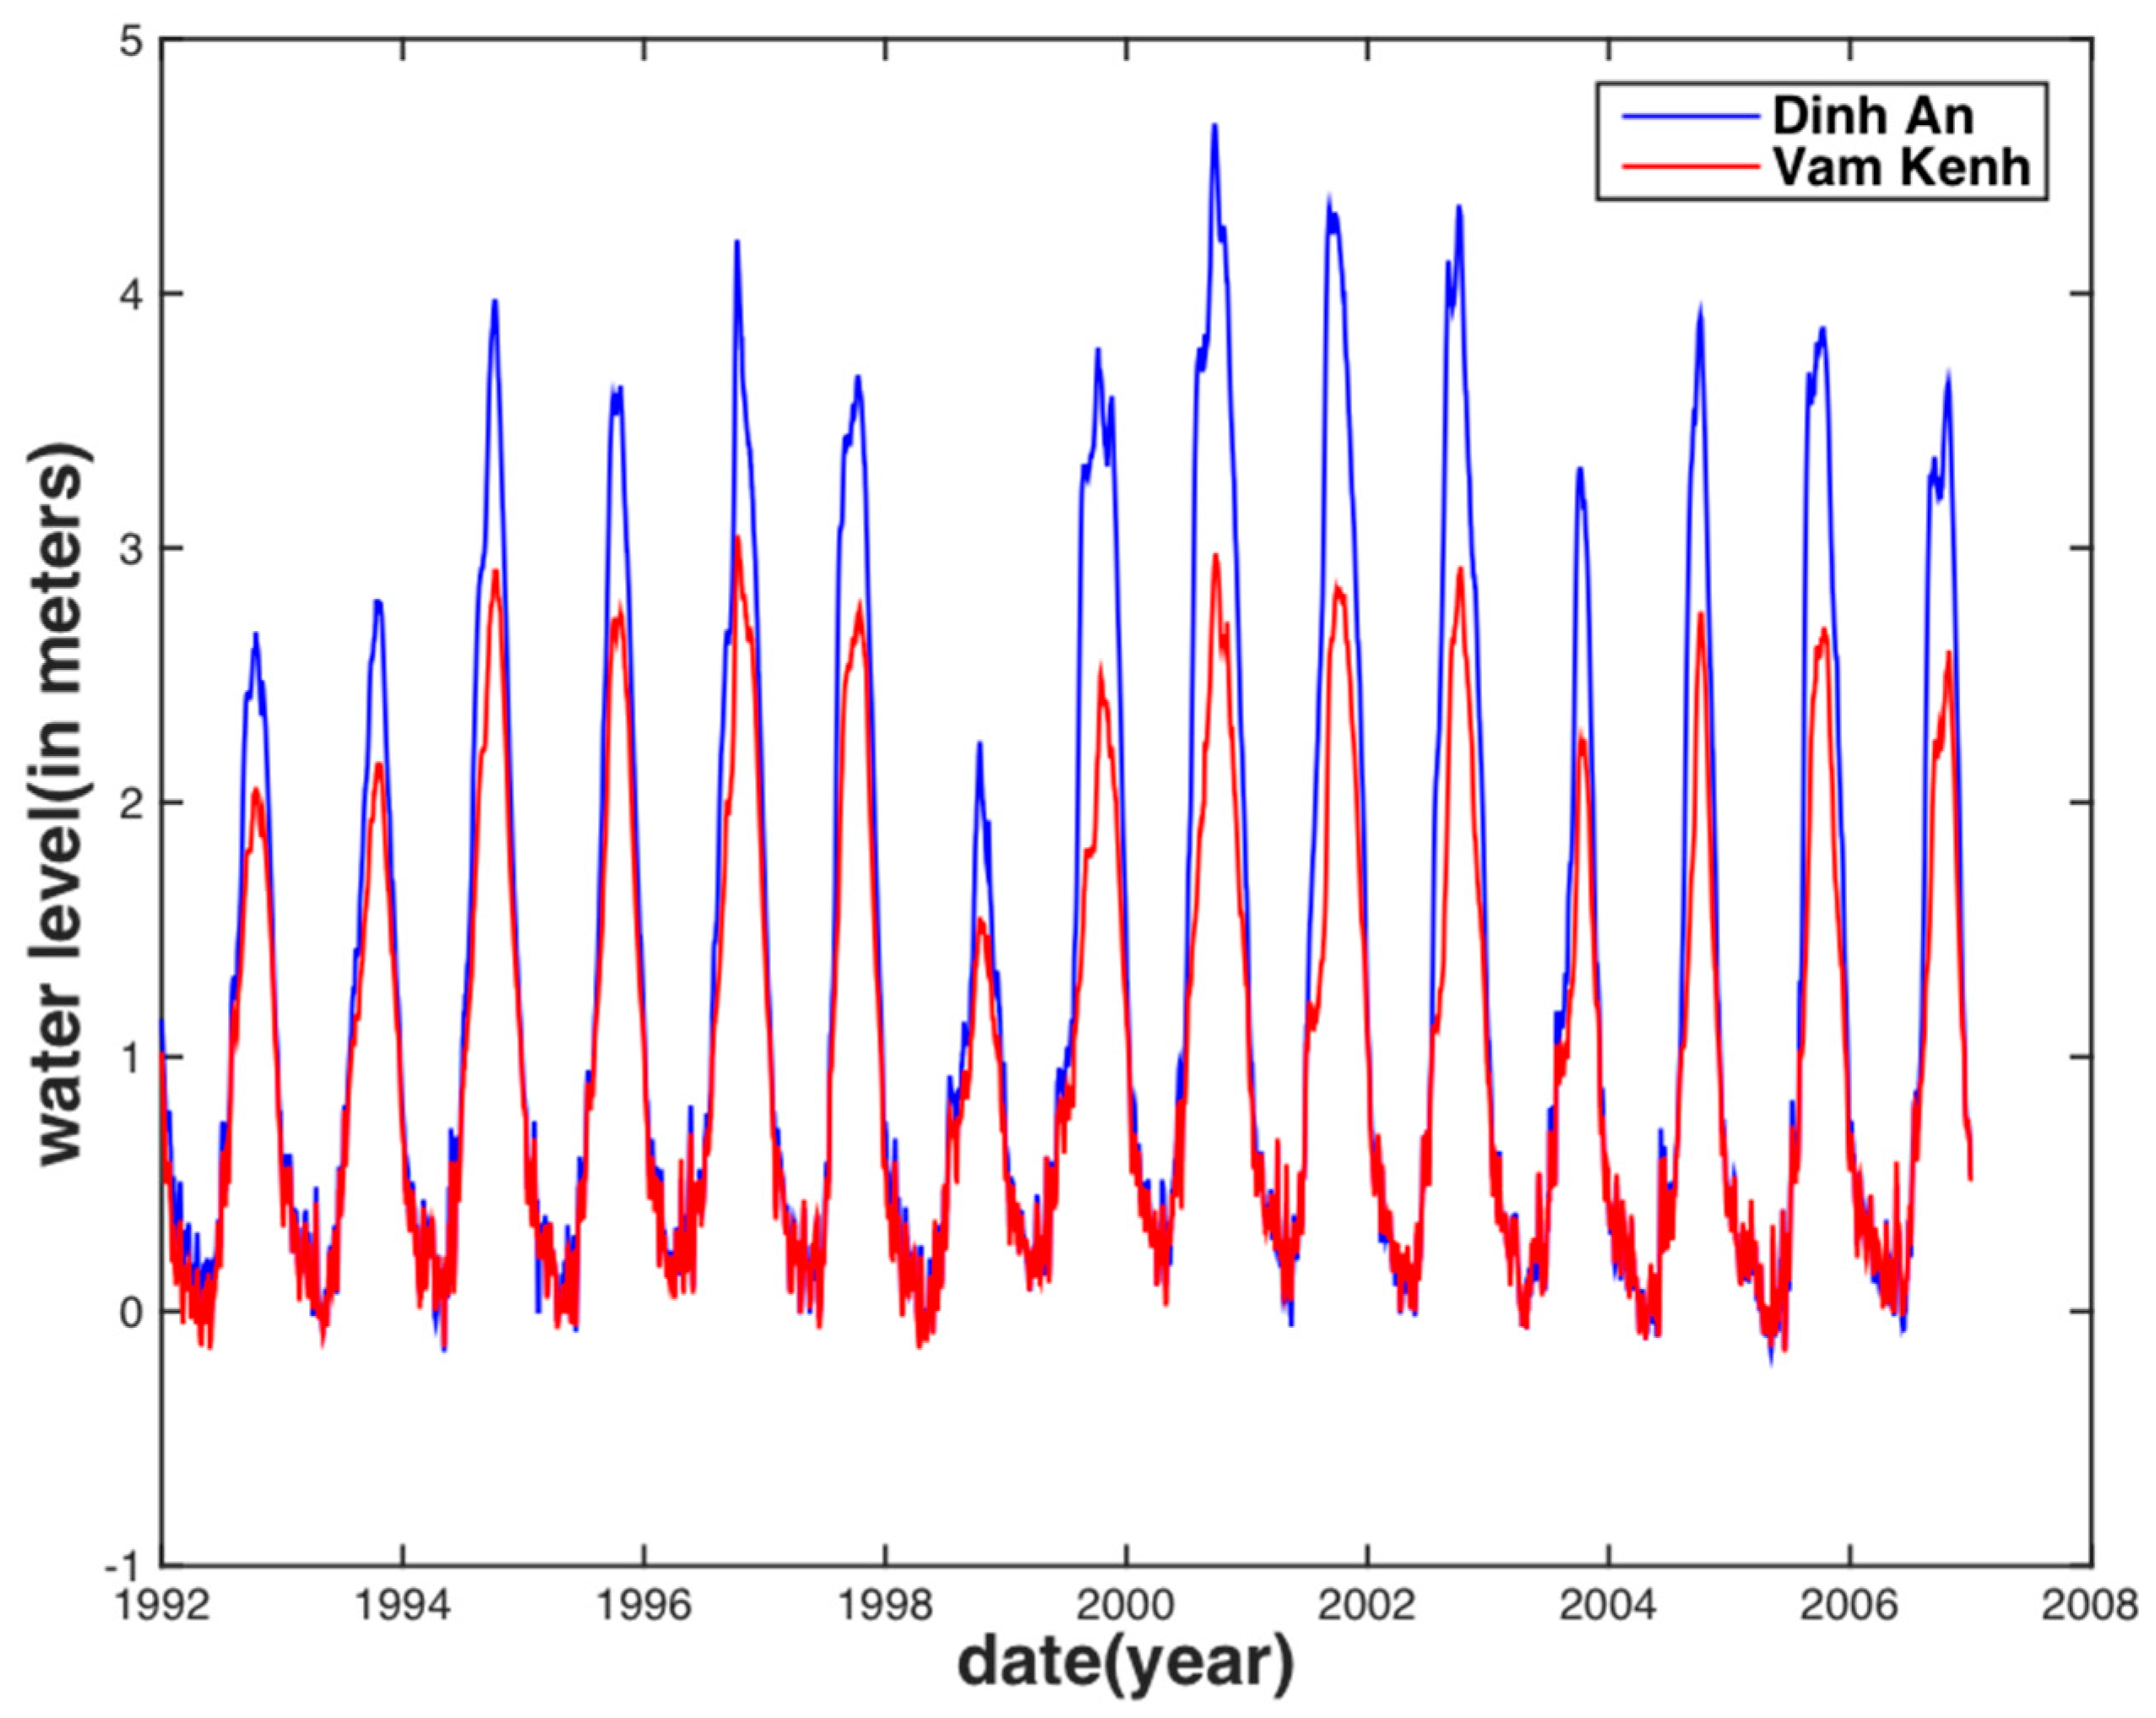
Ground-based, in-situ data, at both the Vam Kenh and Dinh An stations, were chosen to correlate with the modeled indices and to conduct validation, respectively, in this study (Figure 1b) due to their geographic location near the estuary mouth and longer data time span, when compared to other stations (Figure 1a). These data are available on request at Mekong River Commission (MRC) (http://www.mrcmekong.org). Apparently, both station time series, with data spanning between 1 January 1992 and 31 December 2006, exhibit a strong similarity and share the same periodicities of 342 days, 176.6 days, and 1369 days, except with different amplitudes (Figure 2). A yearly peak usually occurs in September corresponding to severe flooding for the aforementioned southwest monsoon, and the lowest water level occurs in April, which is consistent with the general description in Section 2.1.
Remote sensing products for the land surface derived from the Moderate Resolution Imaging Spectroradiometer (MODIS) (National Aeronautics and Space Administration (NASA), Washington DC, USA) [44] were used, which are available from the Land Processes Distributed Active Archive Center (LP DAAC) managed by the NASA Earth Science Data and Information System (ESDIS) project (https://lpdaac.usgs.gov/dataset_discovery/modis/modis_products_table). For the above data products, Normalized Difference Vegetation Index (NDVI) data from the MOD13C2 product and the land surface temperature (LST) data from the MOD11C3 product were chosen, serving as a baseline for comparison with the PDSI and ENSO indices. To be comparable with the time span of ground-based observations, remote sensing data were utilized up to the end of the year 2006.
2.3. Palmer Drought Severity Index (PDSI)
The Palmer Drought Severity Index (PDSI) [14], widely used in the United States [45], is a standardized index based on a soil-moisture water balance model that quantifies meteorological drought utilizing all available temperature and precipitation data to estimate relative dryness. It ranges between −10 (dry) and +10 (wet). The index has proven that it is strong at capturing long-term drought, while weak in recognizing short-term drought. The PDSI modeled data at 2.5° × 2.5° spatial resolution are readily available at http://www.cgd.ucar.edu/cas/catalog/climind/pdsi.html [22].
2.4. El Niño–Southern Oscillation (ENSO) Indices
The El Niño–Southern Oscillation (ENSO) is an irregularly periodic climatic event that is caused by the interaction between the atmosphere and ocean over the tropical eastern Pacific Ocean. It can manifest from sea-level atmospheric pressure differences and sea surface temperature (SST) anomalies [24]. El Niño and La Niña represents the warming and cooling phases of the ENSO events, respectively. Such events can lead to floods and droughts that occur every few years and last several months.
Several studies have been conducted to classify different types of ENSO events based on spatial location, occurrence period, and during which season it occurred within a year. For instance, for spatial locations, ENSO events could be divided into two types: one with a center in the central Pacific and the other in the eastern Pacific [46,47,48,49]. According to the occurrence period, two types have a dominant period of about two years (central Pacific) and ranging from two to four years (eastern Pacific), respectively [48]. On the basis of the occurrence season, Xu and Chan [50] classified it into spring-occurring and summer-occurring ENSO events. Combining these two classifications, the ENSO events that are located in the central Pacific are likely to occur in the summer and mainly have a two-year period (namely the central Pacific type), whereas these events situated in the eastern Pacific may start in spring and their dominant period varies from two to four years (namely the eastern Pacific type).
Numerous SST-based ENSO indices have been derived using different areas of the equatorial Pacific Ocean (e.g., Niño 3 (eastern tropical Pacific) region, Niño 4 (central tropical Pacific) region and Niño 3.4 (eastern-to-central Pacific)). Taking into consideration indices for the ENSO events (i.e., the central Pacific type and the eastern Pacific type) in the ocean, in the atmosphere, and coupled atmosphere–ocean systems, the index SST anomaly in Niño 3.4, the Southern Oscillation Index (SOI), and Multivariate ENSO Index (MEI) were used in this study. All ENSO indices were available from https://www.esrl.noaa.gov/psd/data/climateindices/list/.
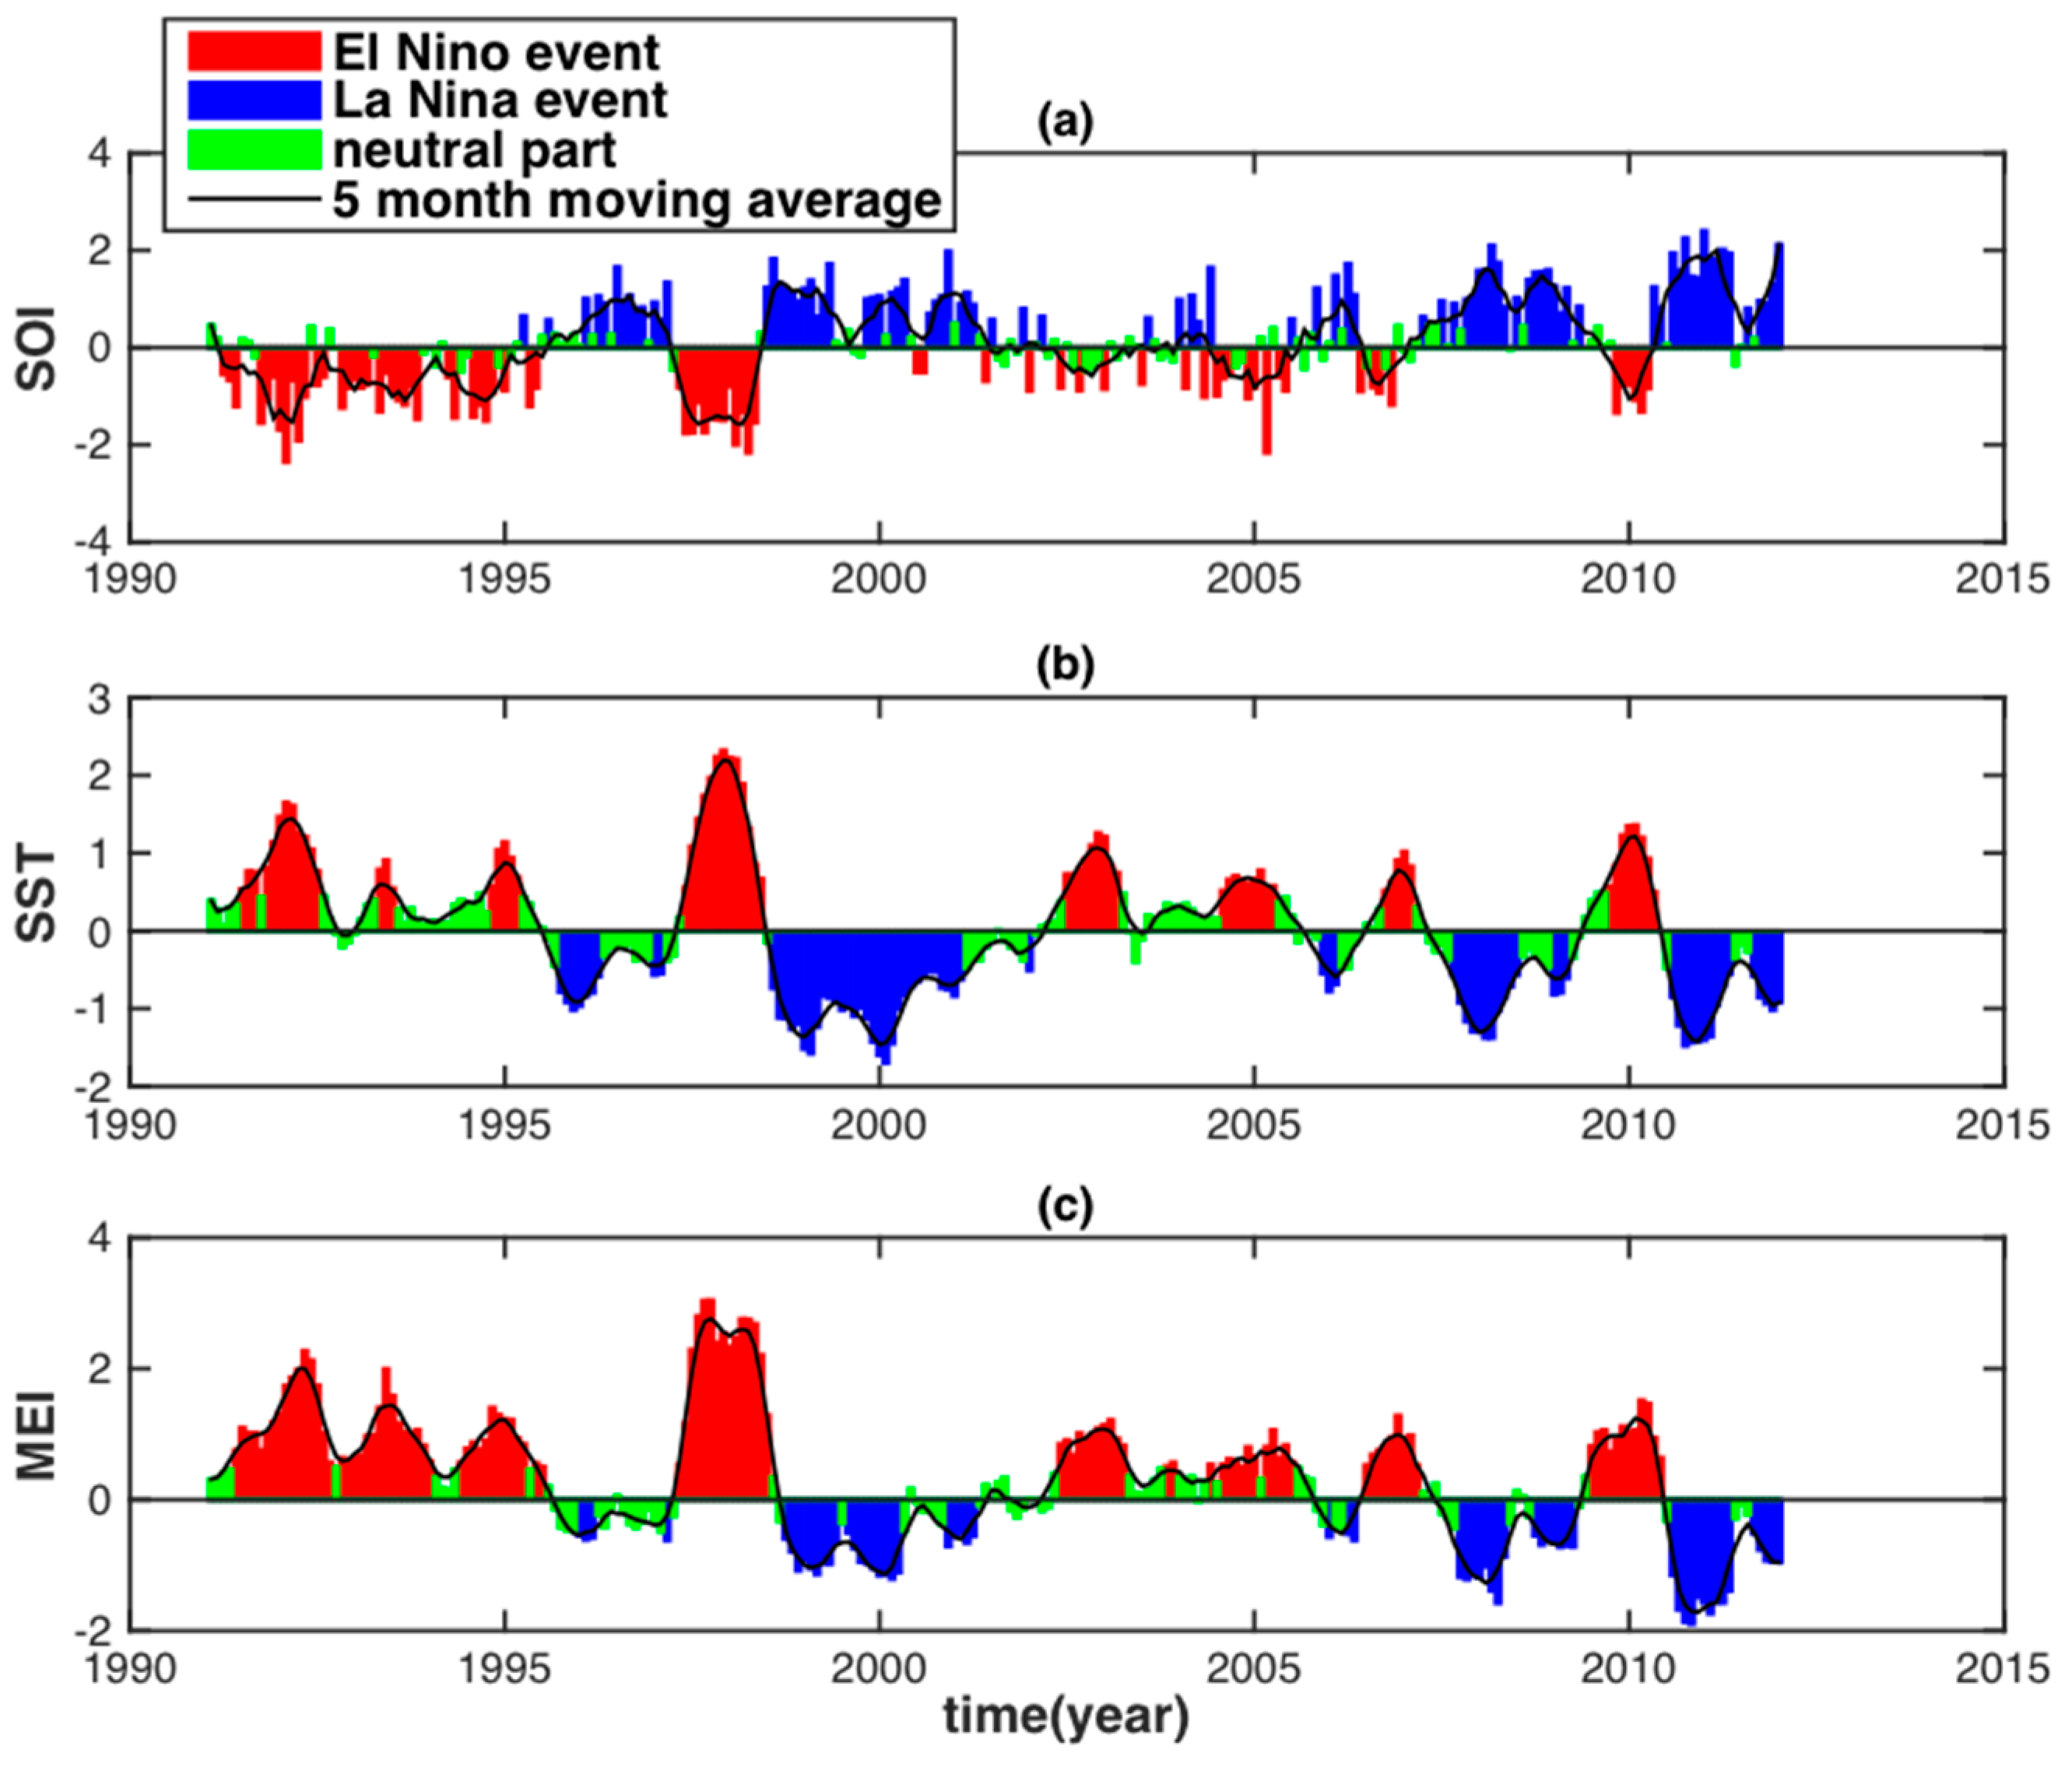
Figure 3 displays the ENSO events using SOI, SST anomalies in the eastern tropical Pacific Ocean area (5° N–5° S, 120° W–170° W, called Niño 3.4 region), and MEI. The ENSO event starts when both the El Niño and La Niña event occurs in a pair with various intensities and irregular periods and durations. In addition, the SST anomaly in the Niño 3.4 region and MEI have a high correlation with each other, while being negatively correlated with SOI.
Based on the guidelines from the Climate Prediction Center of the National Oceanic and Atmospheric Administration (NOAA) National Centers for Environmental Prediction, the SST anomaly index for the Niño 3.4 region should meet two criteria for the identification of an El Niño (or La Niña) event: (i) the five-month running means of absolute SST anomaly values are larger than or equal to 0.5 °C and (ii) it persists for at least six months. From the intensity guidance (Table 1) and time series of SST anomalies between 1991 and 2012 (Figure 3b), two obvious El Niño events (1991–1992, 1997–1998) and one obvious La Niña event (1998–2001) can be observed, which have a longer duration and stronger intensity within our water level study periods. Based on SST anomaly values and the criteria of ENSO events, the El Niño in 1991–1992 and in 1997–1998 ranged from June 1991 to June 1992, and from May 1997 to May 1998, respectively, whereas La Niña in 1998–2001 spanned from July 1998 to January 2001. These three events are expected to have had a strong influence on the Mekong water levels.
3. Methodology and Assessment Scheme
3.1. Correlative Analysis and Water Level Standardization Results
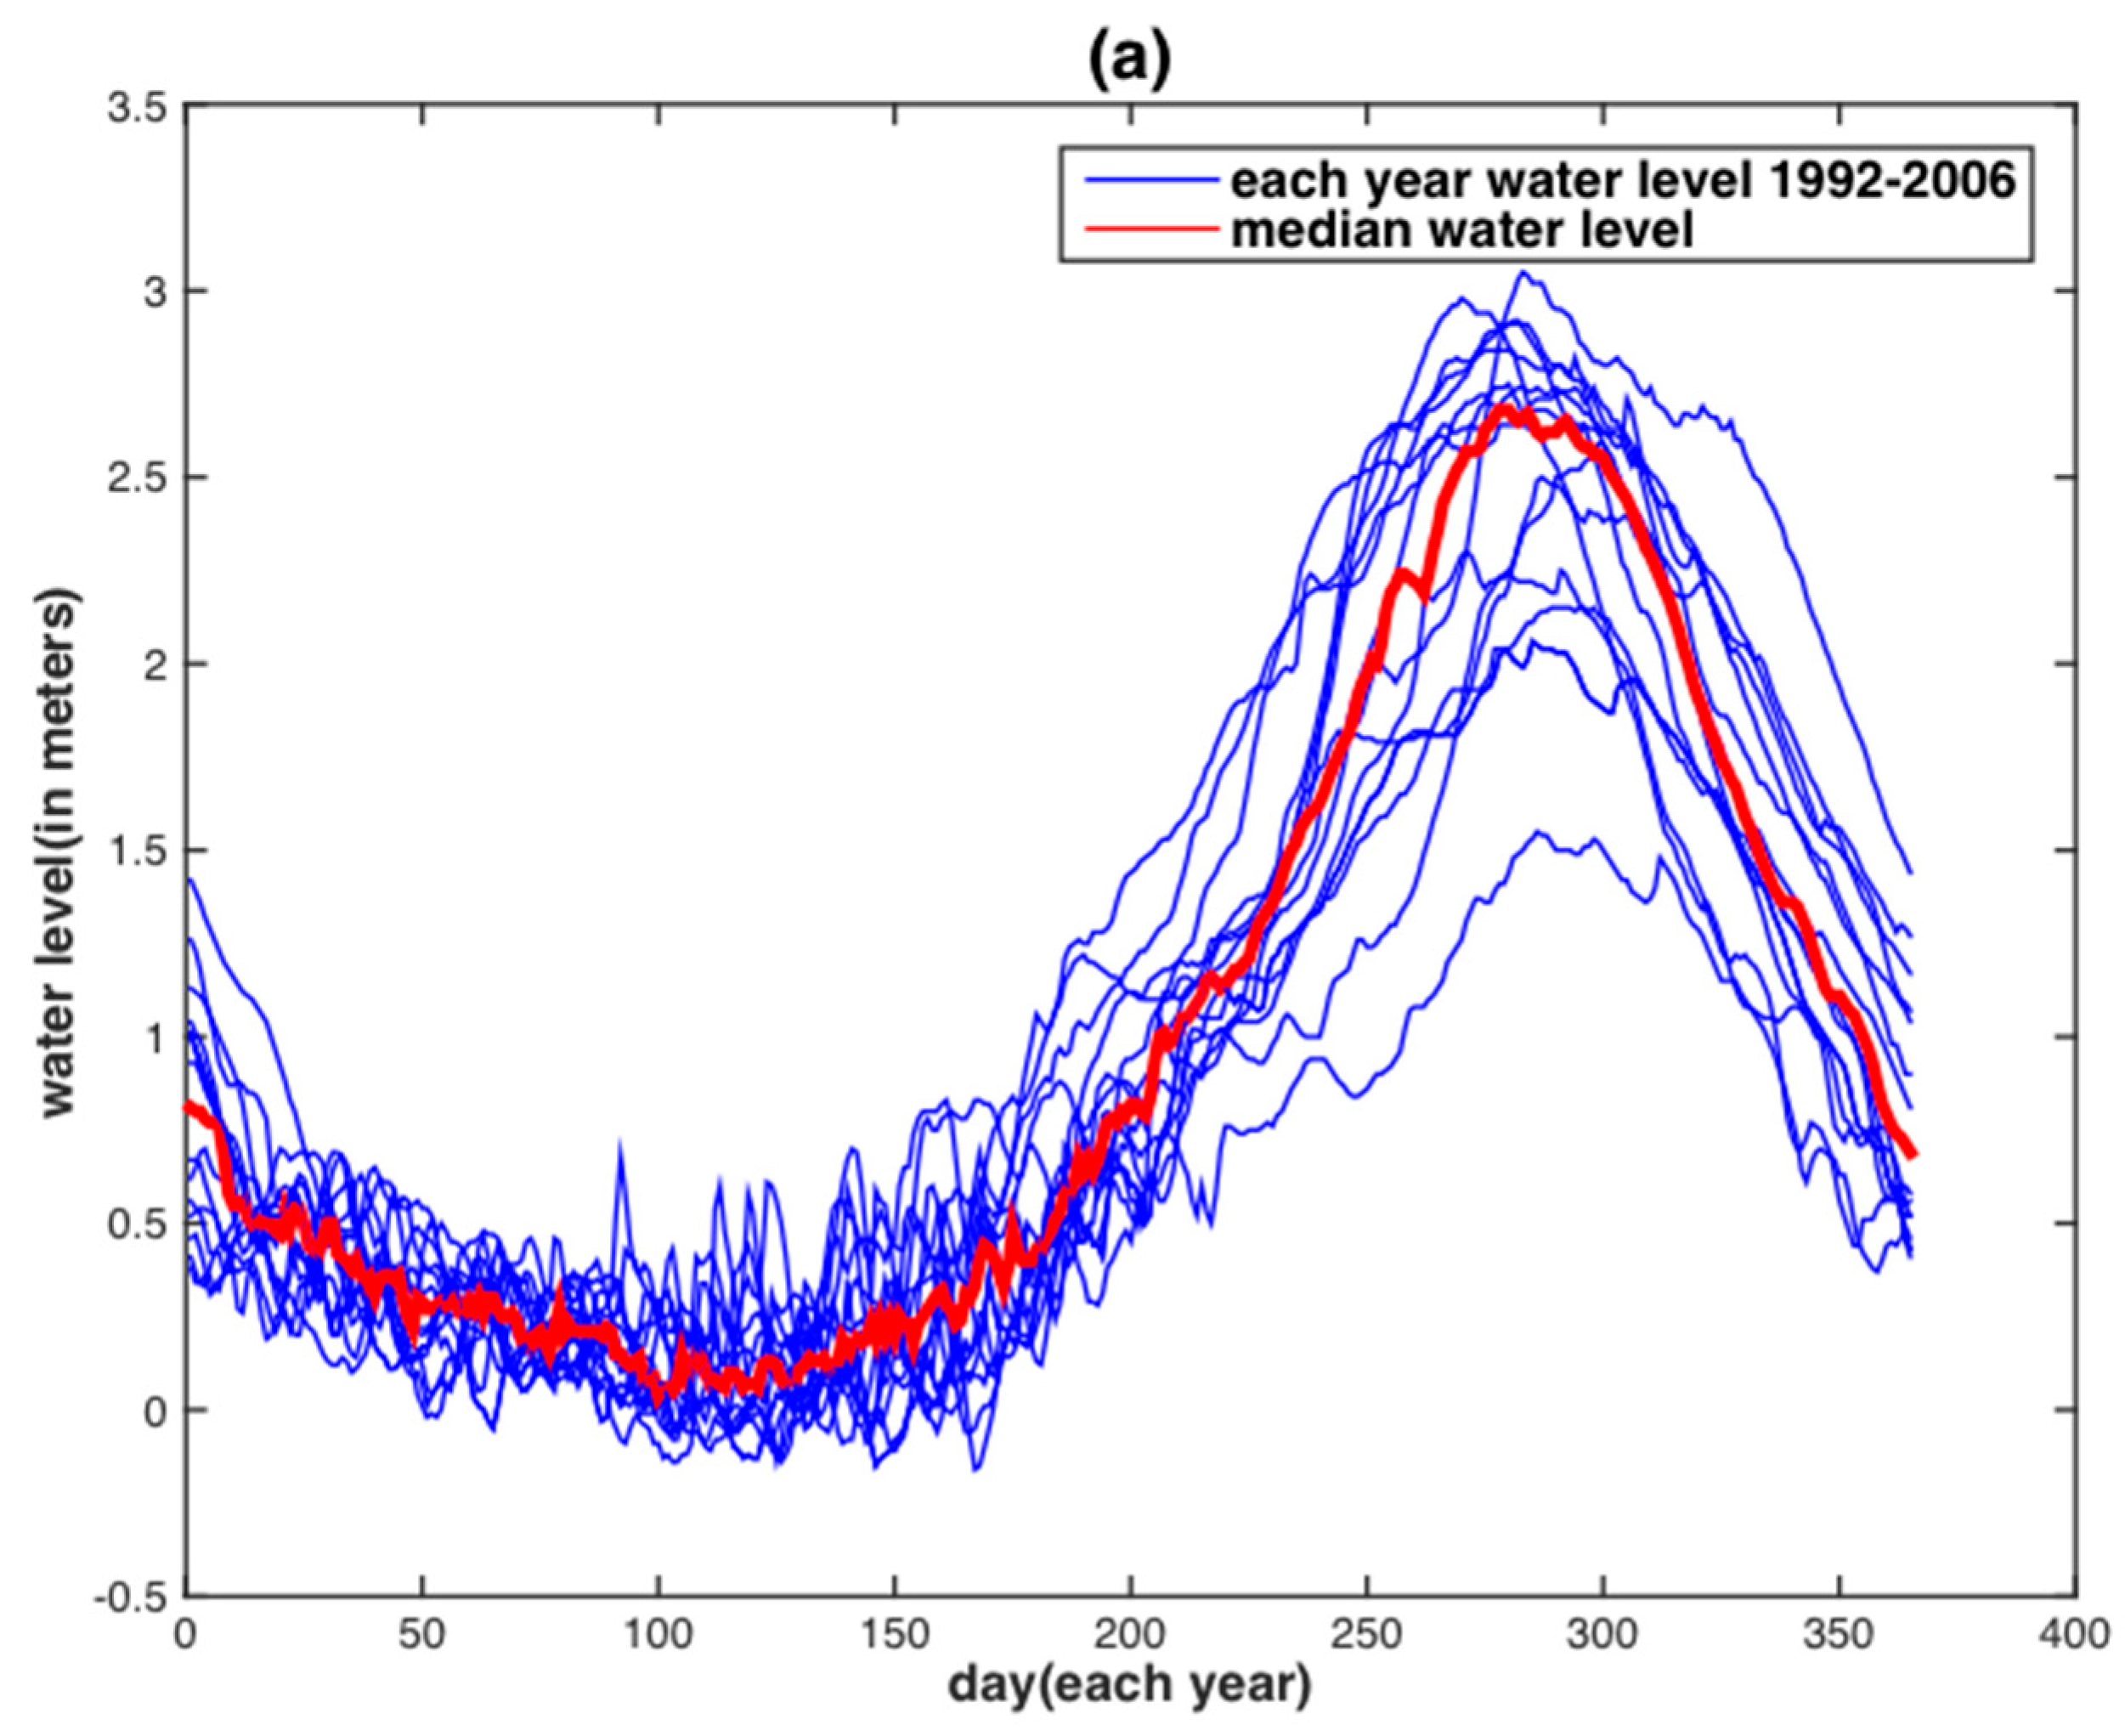
The NDVI and LST time series are consistent with the observed water level series (i.e., Vam Kenh station). Therefore, linear regression (i.e., a model fitting with an offset plus a slope) was directly applied to establish a correlative relationship between the observed water level and those remote sensing data (i.e., NDVI and LST) within the overlapping period for both the time series (i.e., from January 2000 to December 2006). Owing to less obvious and direct connections between the monthly PDSI and ENSO index time series and the observed water level time series, observed water levels were standardized to be consistent with the PDSI and ENSO indices before establishing their correlative relationship. This can be achieved by subtracting the monthly averaged water level from the monthly median values (called water level anomaly) for the entire 15-year data time span divided by standard deviation of the corresponding month (Figure 4a).
To increase the ability to capture ENSO events and remove noise from the PDSI index, two extra preprocessing procedures were conducted to create an ENSO-assisted PDSI. First, we observed that the PDSI upstream had a stronger sensitivity in dryness conditions than that downstream. Therefore, a representative PDSI data time series point upstream in the Mekong River during ENSO events had to be selected owing to the lesser influence of ENSO events upstream than downstream. The PDSI gridded value very close to Vam Kenh station was not used to avoid potential contamination from the ocean. Second, smoothing and re-scaling processes had to be applied to PDSI data before a correlative analysis could be made. This can be achieved by a five-month moving averaging process with PDSI value re-scaling that matches the water level in a standardized form.
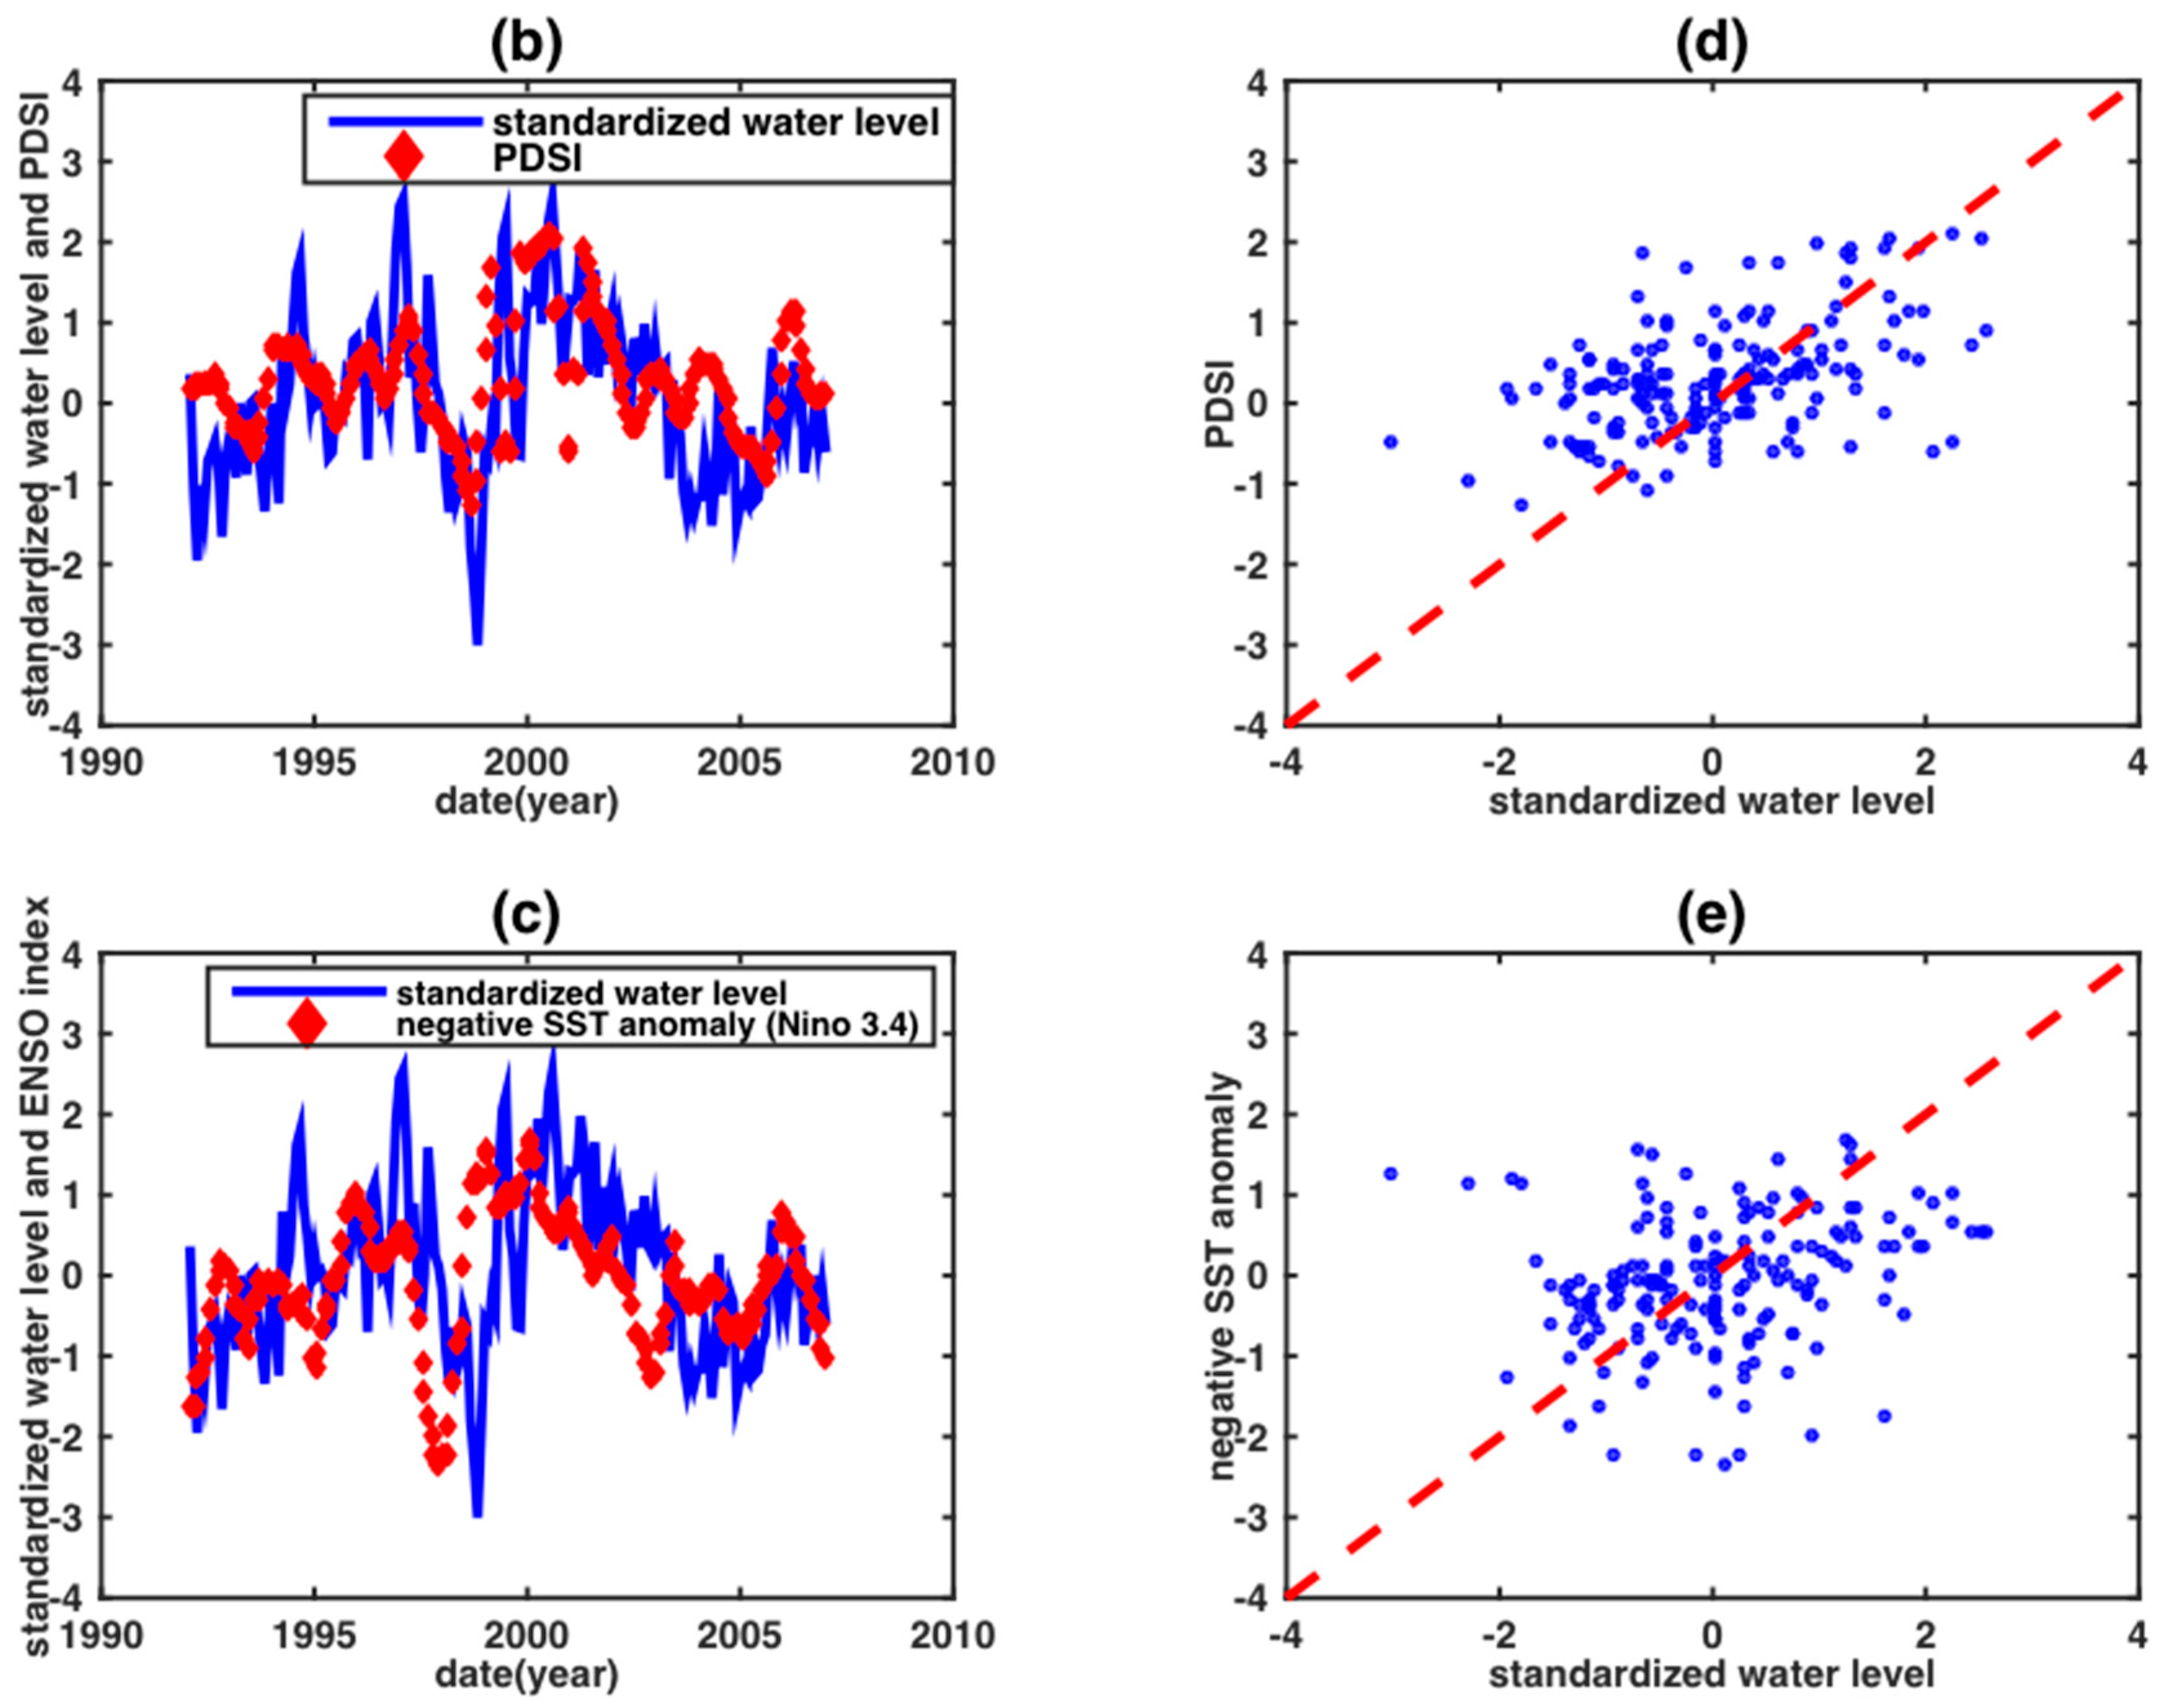
It can be revealed that the PDSI is strongly correlated to the standardized water level anomalies (Figure 4b). A time lag between negative SST and water level anomalies is observed (Figure 4c), because it takes several months for the water level in the Mekong delta to start its response to an ENSO event. Based on a detailed analysis of SST and water level anomalies, we observed that there is a six-month lag before year 1998 and a nine-month lag after January 1998. These lags suggest that there is a teleconnection between the ENSO indices and the water level in the Mekong delta. Many researchers have studied the teleconnections between ENSO events and hydrological variables, such as river discharge [52], precipitation [53], and water storage [49]. In fact, time lag analysis (e.g., [54]) is widely used to improve hydrological modeling.
In this study, the time-lagged El Niño information was utilized to improve our water level reconstruction during the El Niño events. In our study periods (January 1992 to December 2006), two obvious El Niño events (i.e., 1991–1992 El Niño and 1997–1998 El Niño) cause the six-month lag and nine-month lag, respectively. From Table 1, it can be seen that the intensity of the 1991–1992 El Niño beyond the medium level (i.e., SST > 1.06) lasted for six months, and that in 1997–1998 lasted for nine months. This result is consistent with the two observed temporal lags from the analysis of SST and water level anomalies. As a result, when the SST is larger than 1.06, ENSO can affect the Mekong River downstream water level. In addition, the duration of the medium or stronger intensity of ENSO events corresponds perfectly with the time lag of water levels affected by ENSO. As a result, the whole time series can be divided into two sections (January 1992–December 1998 and January 1998–December 2006) based on the two obvious El Niño events. The six-month and nine-month shifts of the SST anomaly time series were applied to the first and the second section, respectively. Owing to the high correlation of other ENSO indices with SST, the same procedure was adopted for the SOI and MEI.
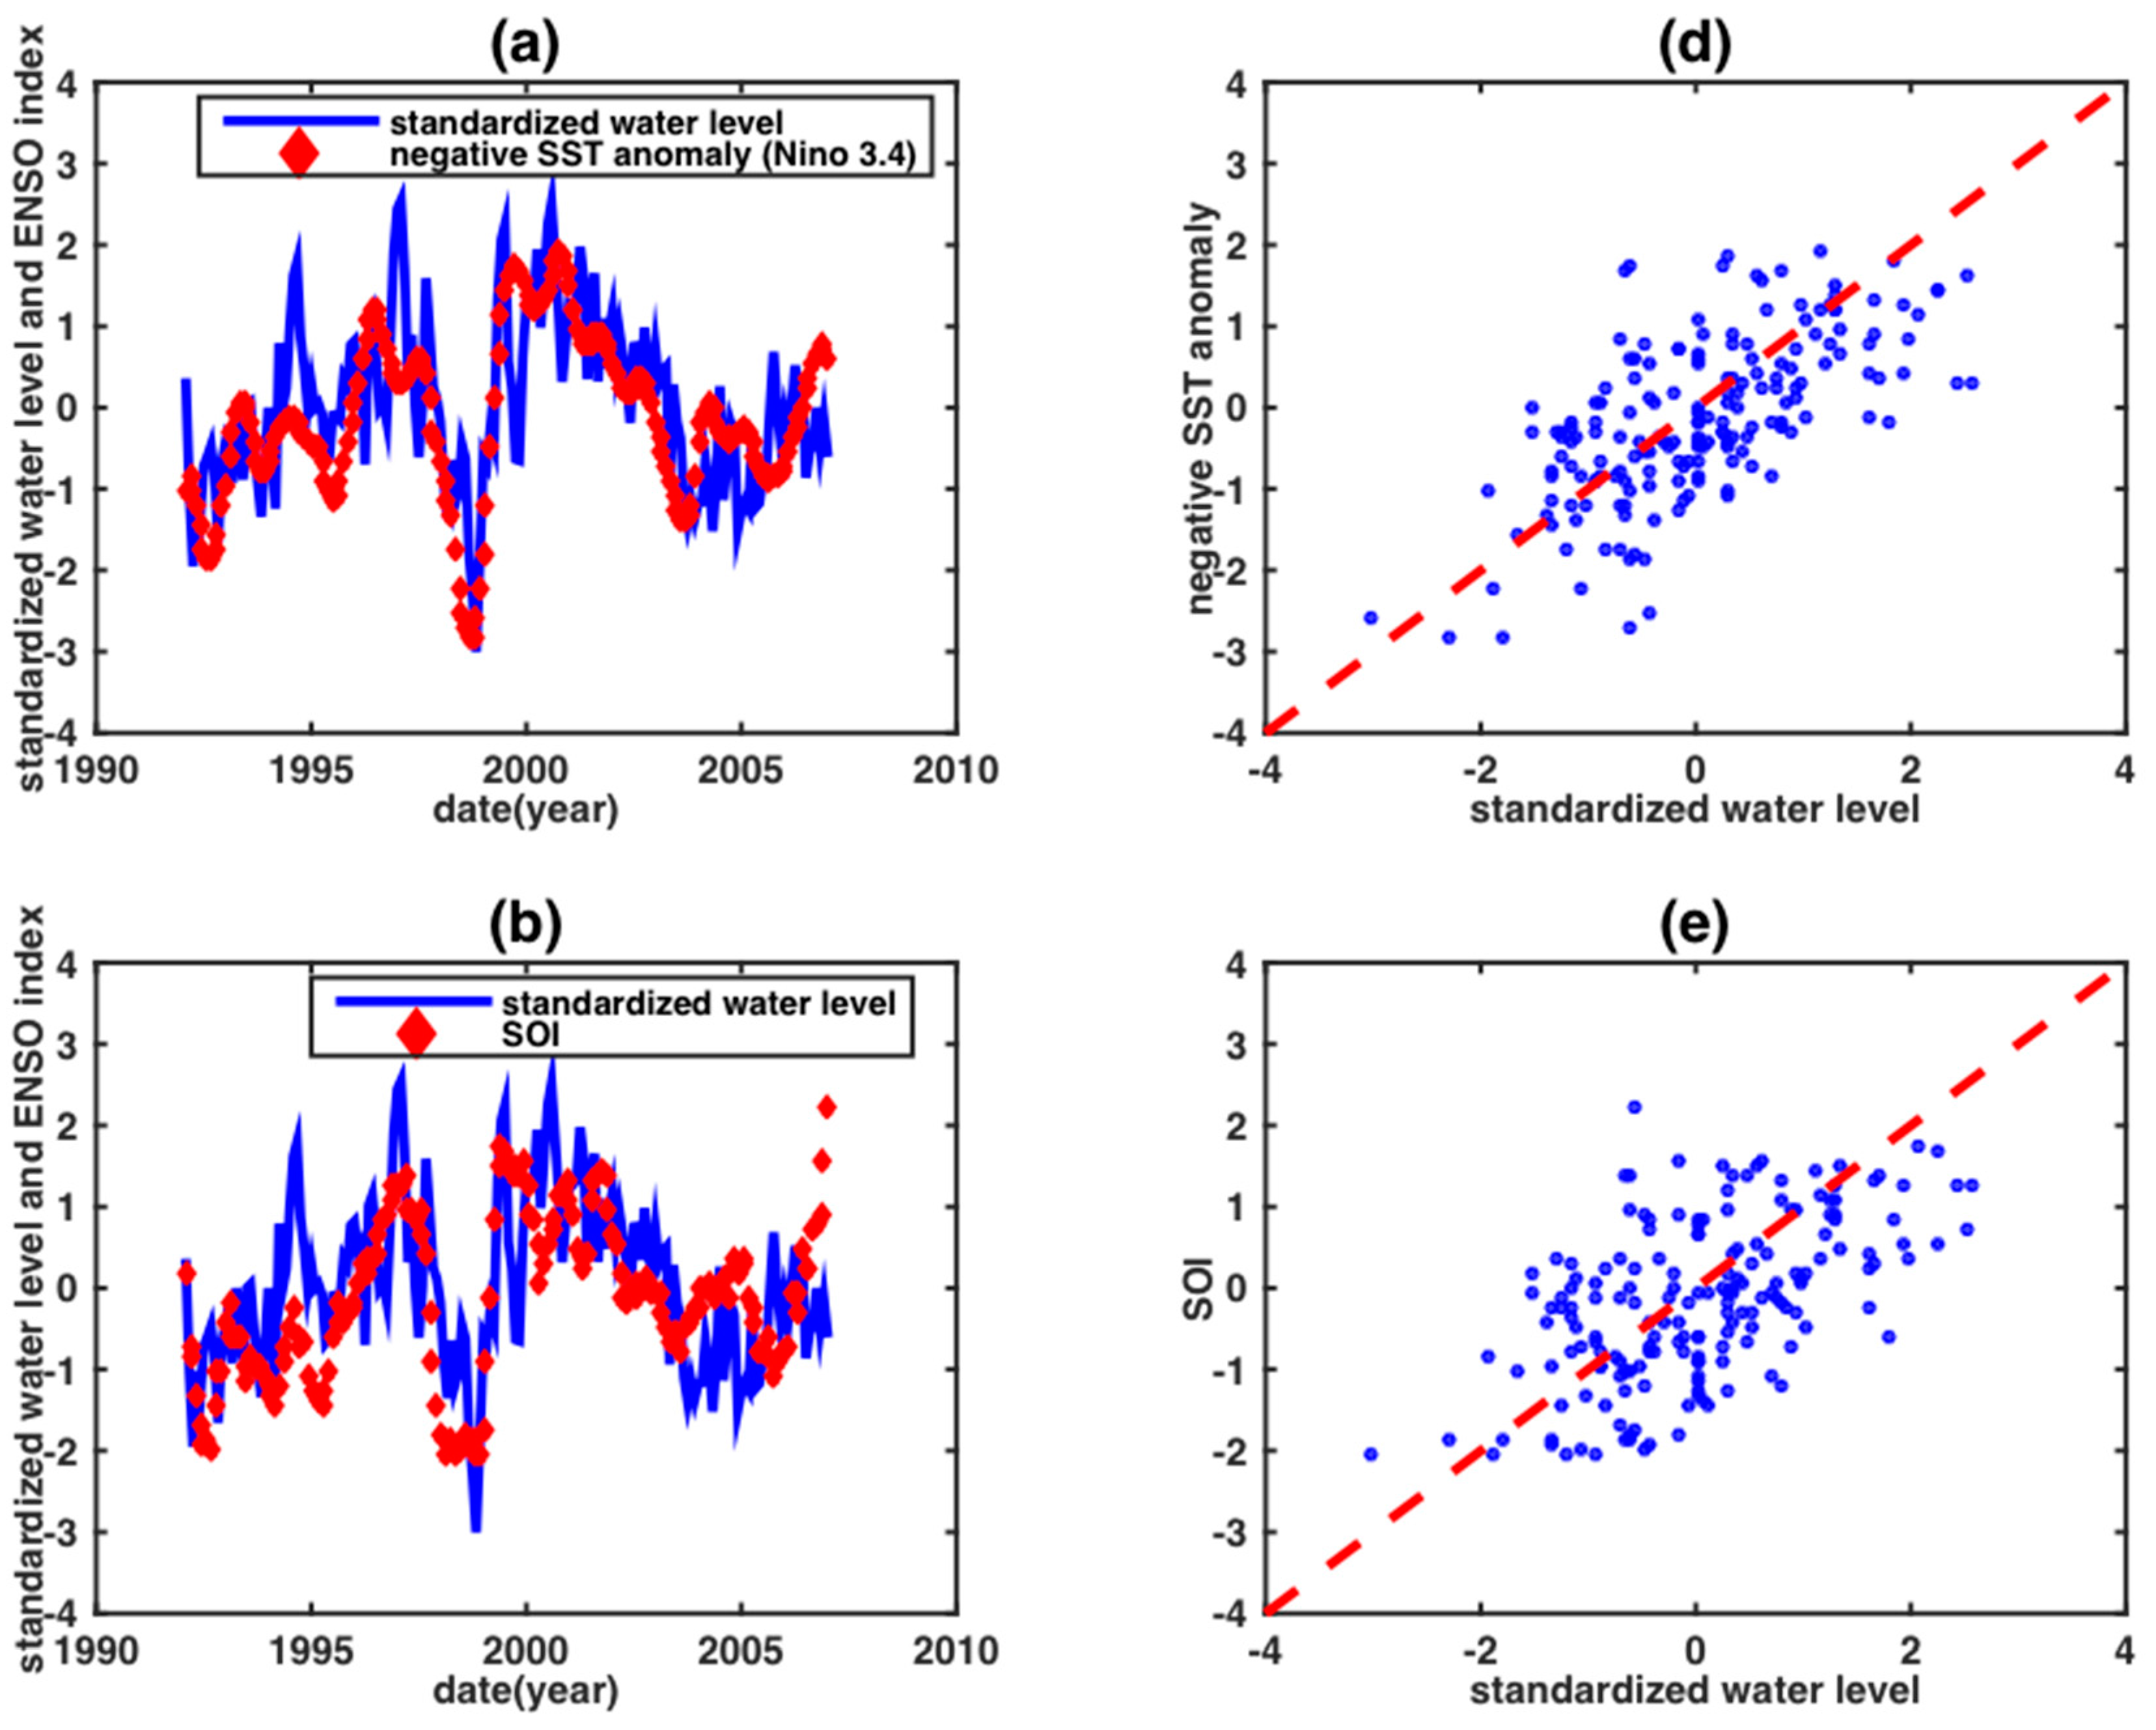
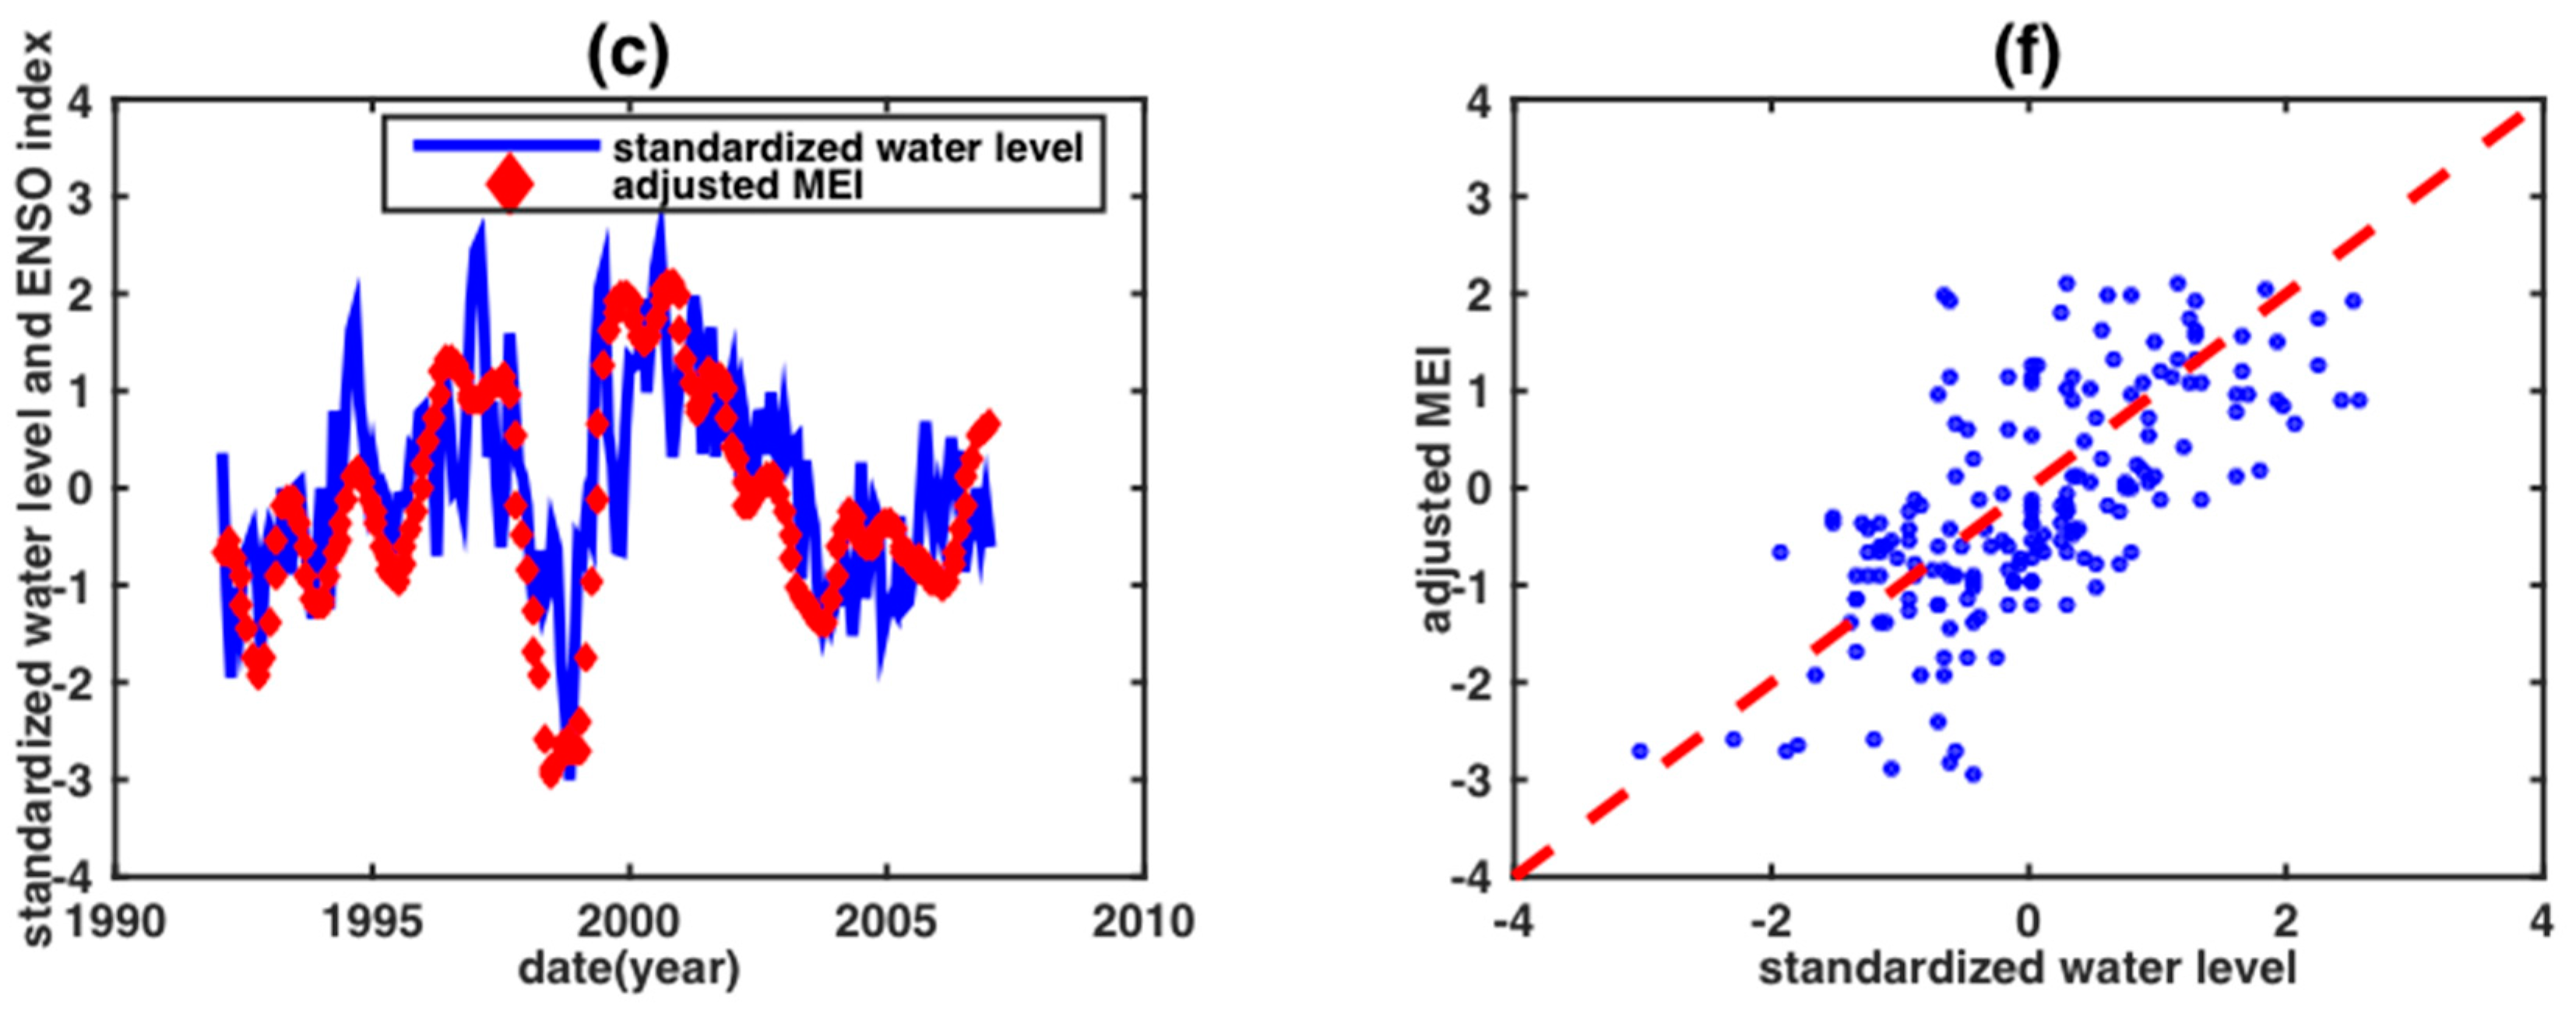
Applying the above-mentioned PDSI data preprocessing procedures to these time-shifted ENSO indices, all ENSO indices showed high agreement with the water level anomaly at the Vam Kenh station (Figure 5). Compared to PDSI, the ENSO indices performed better. For different ENSO indices, the SST anomaly performed the best. As a result, the correlative relationship between the water level and PDSI and ENSO indices was established, which allows the conversion of the PDSI or ENSO indices back into the water level anomalies time series. In other words, the estimated anomalies were then added back to the seasonal monthly median values to reconstruct the water level.
3.2. Result Assessment Schemes
To conduct a comparison between observed water levels and estimates derived from the indices, the Pearson correlation coefficient (PCC), root mean square error (RMSE), and Nash–Sutcliffe model efficiency (NSE) coefficient were chosen to assess the performance of each index. PCC is a number that quantifies the linear relationship between two variables, which is defined as
and RMSE is an accuracy estimate, which is given by
The NSE was developed by Nash and Sutcliffe [55] and is used to evaluate hydrological models. It is calculated as
where represents the observation, is the mean of , and is the estimation. The value of the NSE ranges from −∞ to one. An NSE value higher than zero indicates that the estimation matches well with the observation. The NSE value is negative when the accuracy of the estimation is lower than the accuracy of the observation. Overall, the closer the NSE value is to one, the more reliable the estimation.
4. Results and Discussion
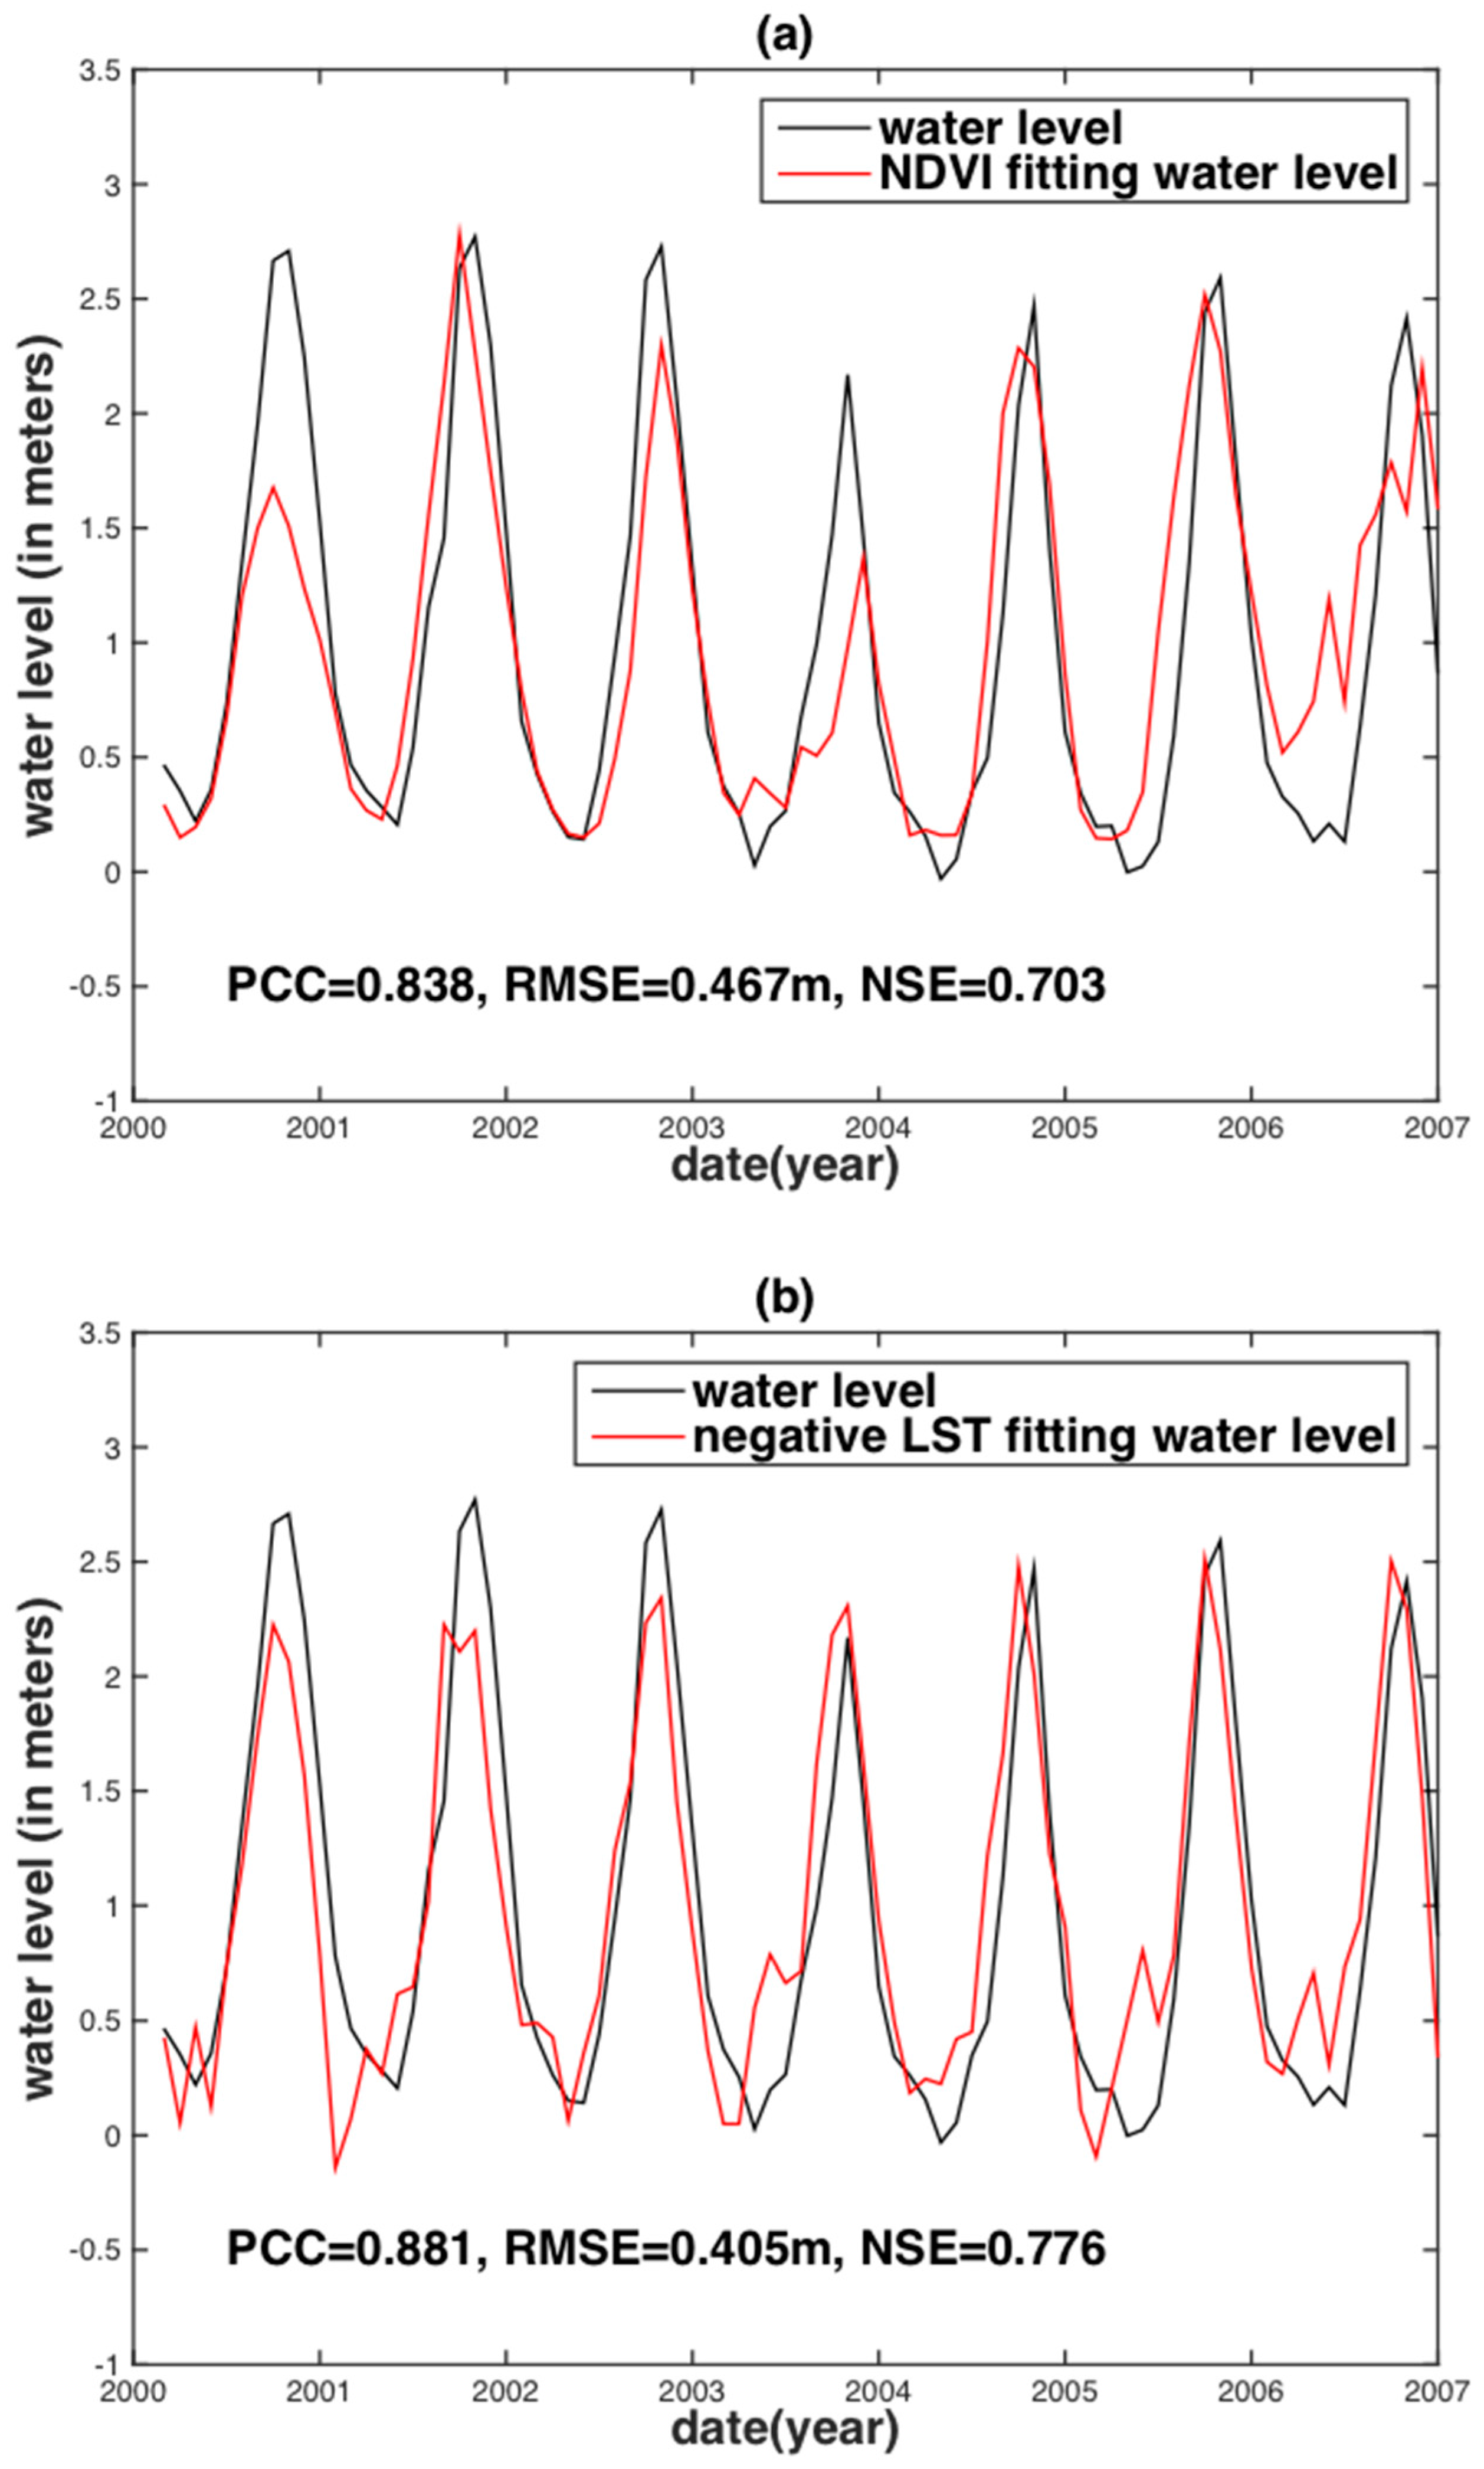
Both an internal and an external assessment were computed to examine whether these indices (including remote sensing indices, PDSI and three kinds of ENSO indices) are suitable for water level reconstruction. To assess the internal correlation, the correlation between the observed Vam Kenh monthly water level and the remote sensing indices (NDVI and LST) were obtained during the corresponding data curve fitting. The corresponding curves were then used to predict the water level. It was found that both the NDVI- and LST-reconstructed water levels match well with the observed water level (Figure 6). However, the peak water levels between the NDVI-reconstructed water level and observed water level show relatively large differences in the years 2000, 2003 and 2004, with the biggest difference occurring in the year 2000. These differences can be attributed to the La Niña event in 1998–2001, which lead to the water level rising significantly in the lower Mekong basin after the event that lagged for several months. The magnitude of the impact of the 1998–2001 La Niña event eventually diminishes over time, with the biggest difference in the year 2000; these differences were reduced in 2003 and 2004. This implies that the NDVI index cannot or can only weakly capture the influence of an ENSO event on water levels in the lower Mekong basin.
On the contrary, the peaks of water level reconstruction derived from LST have smaller disparities with the observed water stage than that of NDVI in the time periods (from January 2000 to December 2004) influenced by the 1998–2001 La Niña, indicating a stronger ability of LST to capture ENSO’s influence on the water level when compared to NDVI. Overall, the remote sensing indices can reconstruct the water stages of the lower Mekong basin, but shortcomings exist, particularly in the time period of ENSO events. The vegetation index (NDVI) and temperature (LST) record the localized instantaneous responses, which are the consequences of regional precipitation and water storage exchange within a hydrological cycle, but not the cause. This is the reason why the water level reconstructions of remote sensing indices are not well represented.
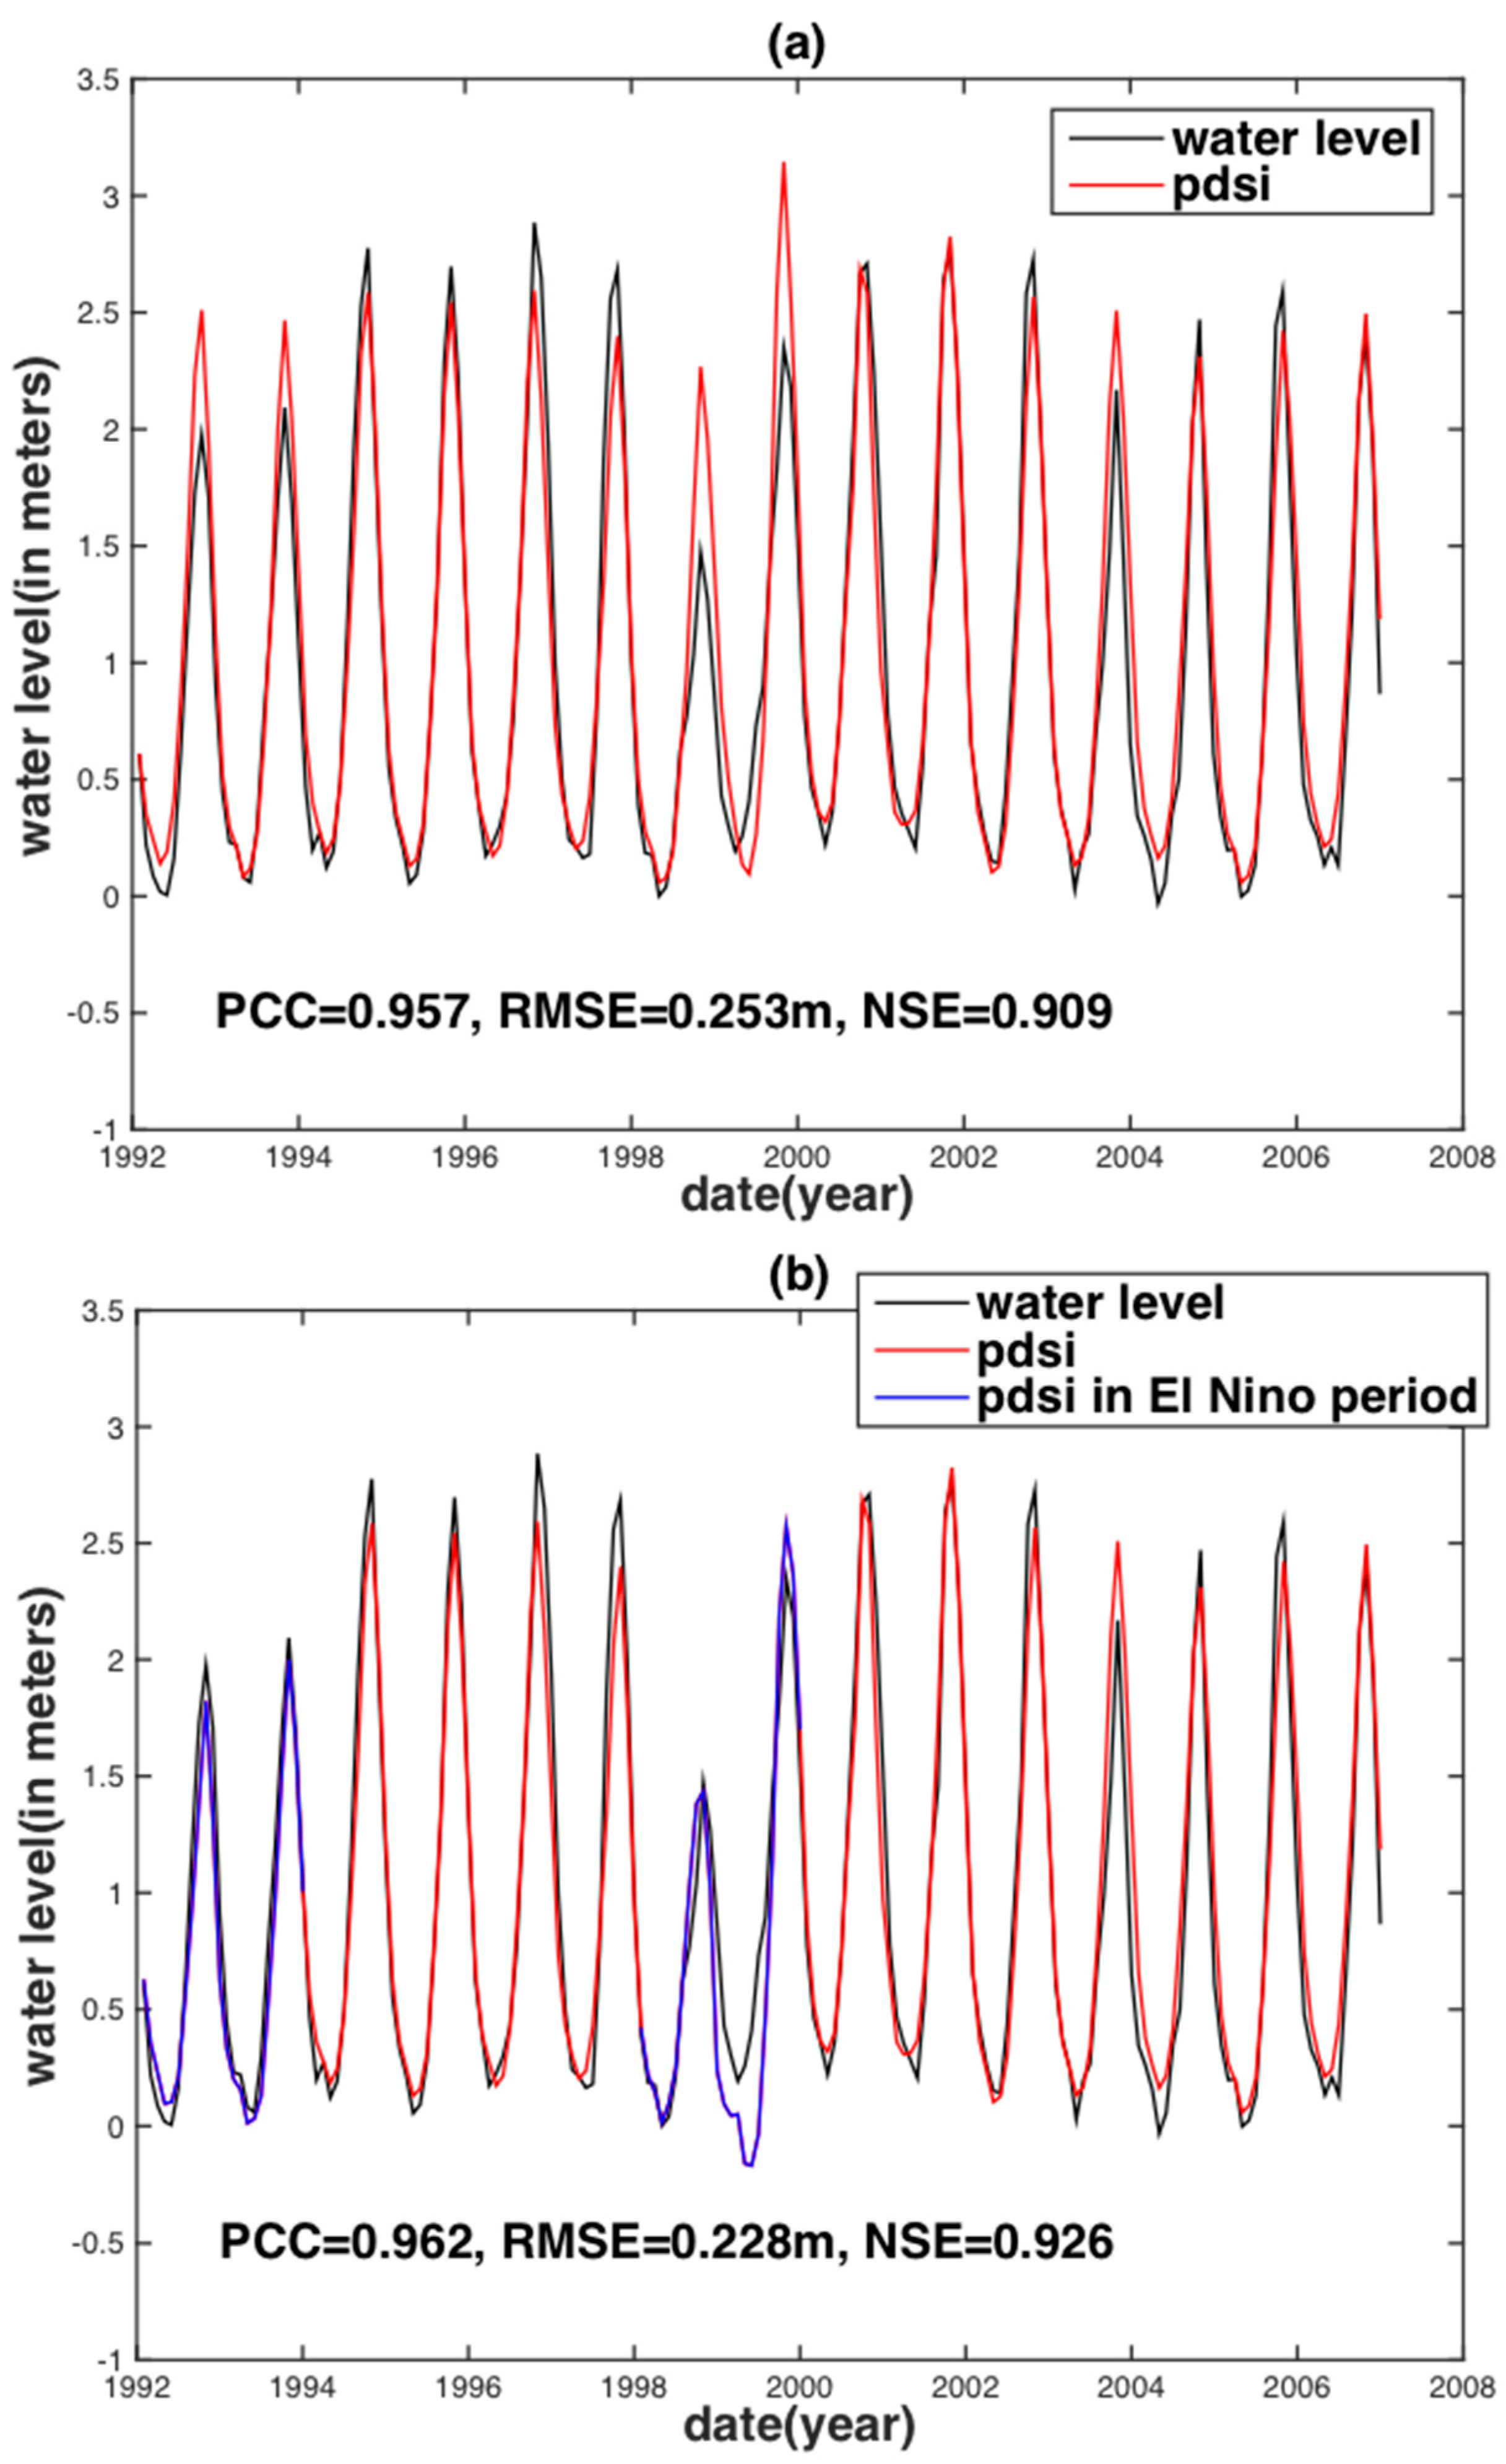
Figure 7a displays the reconstructed water stage based on the PDSI index; the observed water level matches almost perfectly in the study time span except for two periods: from January 1992 to December 1993 and from January 1998 to December 1999. These two periods are squarely close to 1991–1992 El Niño ranging from June 1991 to June 1992 and the 1997–1998 El Niño ranging from May 1997 to May 1998, respectively. Doubtlessly, the differences in the two periods are caused by the two El Niño events separately. The Mekong River Basin lies within the tropical and subtropical latitudes. The ENSO influence on the subtropical region (i.e., upstream) is relatively reduced when compared to the tropical region (i.e., downstream). As a result, the dryness conditions of the PDSI data time series in the upstream of the Mekong River Basin should be more sensitive than that of the downstream for the two above-mentioned mismatched periods. Hence, the PDSI data time series for the upstream Mekong River Basin for the two above-mentioned mismatched periods were chosen to replace the corresponding downstream PDSI.
After replacement, the combined upstream and downstream PDSI (hereafter called ENSO-assisted PDSI) reconstructed water level is almost perfectly in agreement with the observed water level (Figure 7c). There are still slight differences: the peak of the ENSO-assisted PDSI reconstructed water level is a little bit lower than the observed water level peak as a whole. The differences may be attributed to the fact that the PDSI can only consider the moisture within 1-meter subsurface thickness [22], while ignoring the potential presence of water deeper than 1-meter. Overall, ENSO-assisted PDSI can reconstruct water stages very well to monitor droughts and floods, in spite of slight defects.
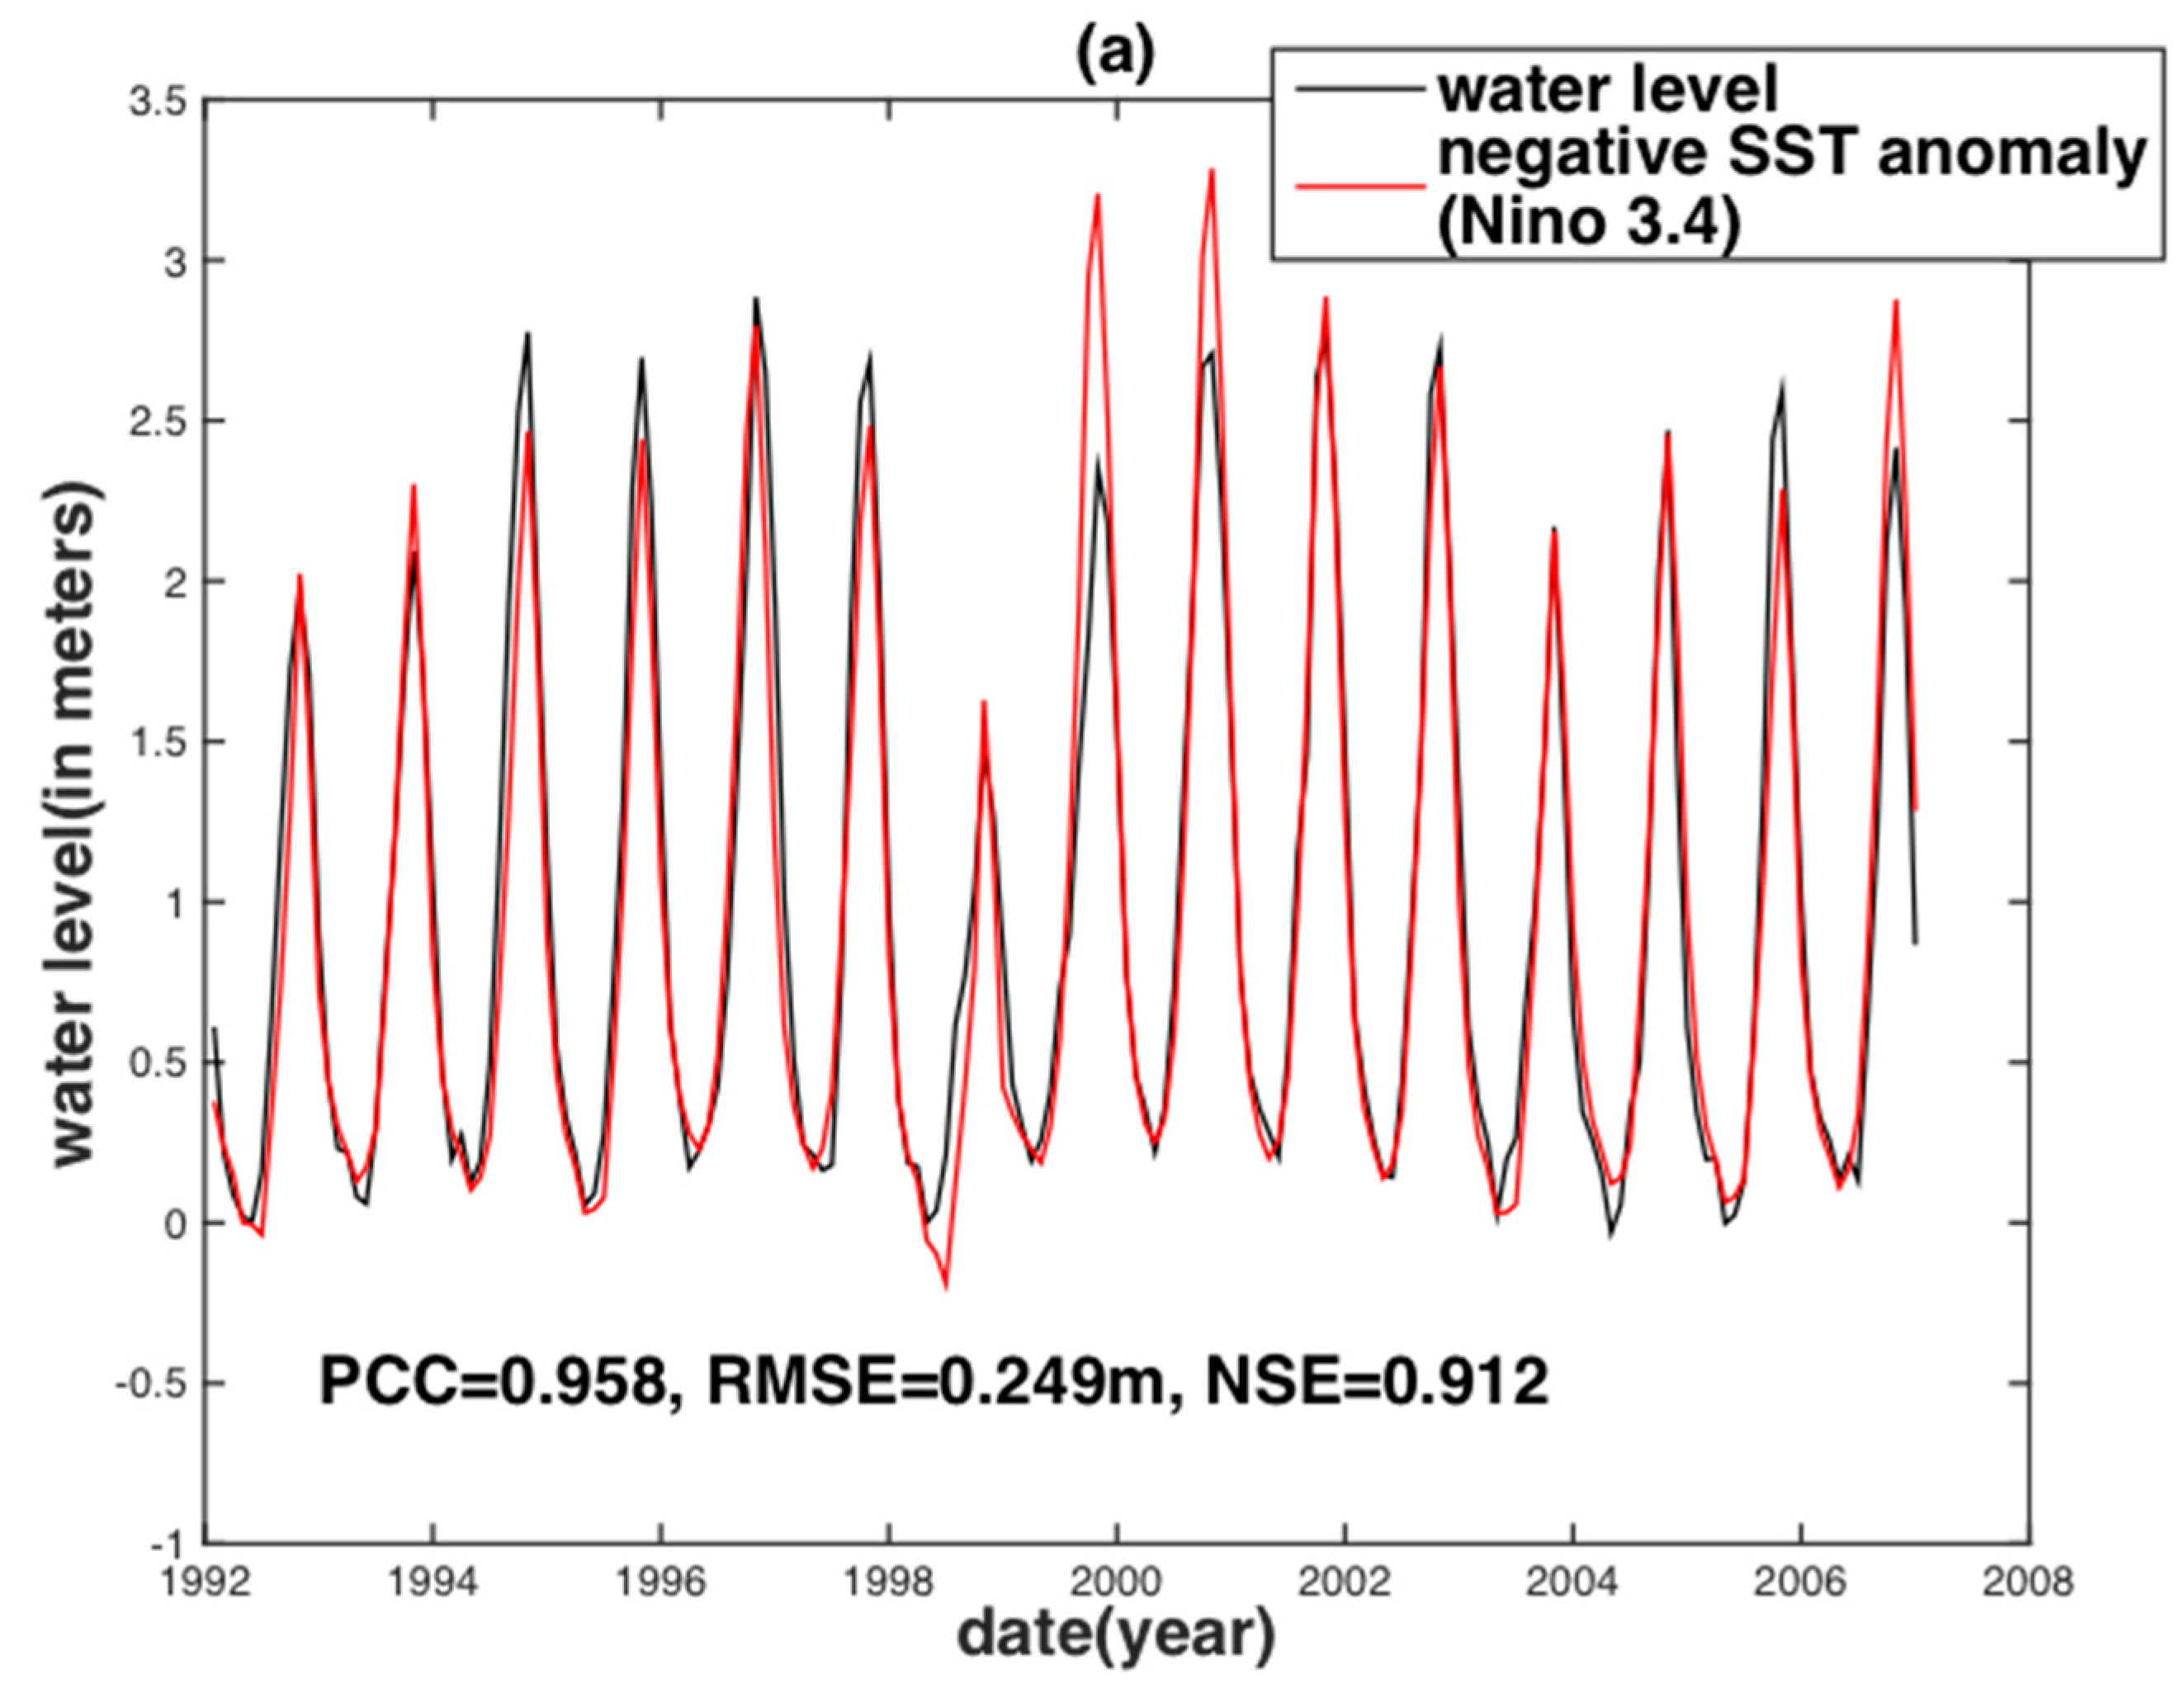
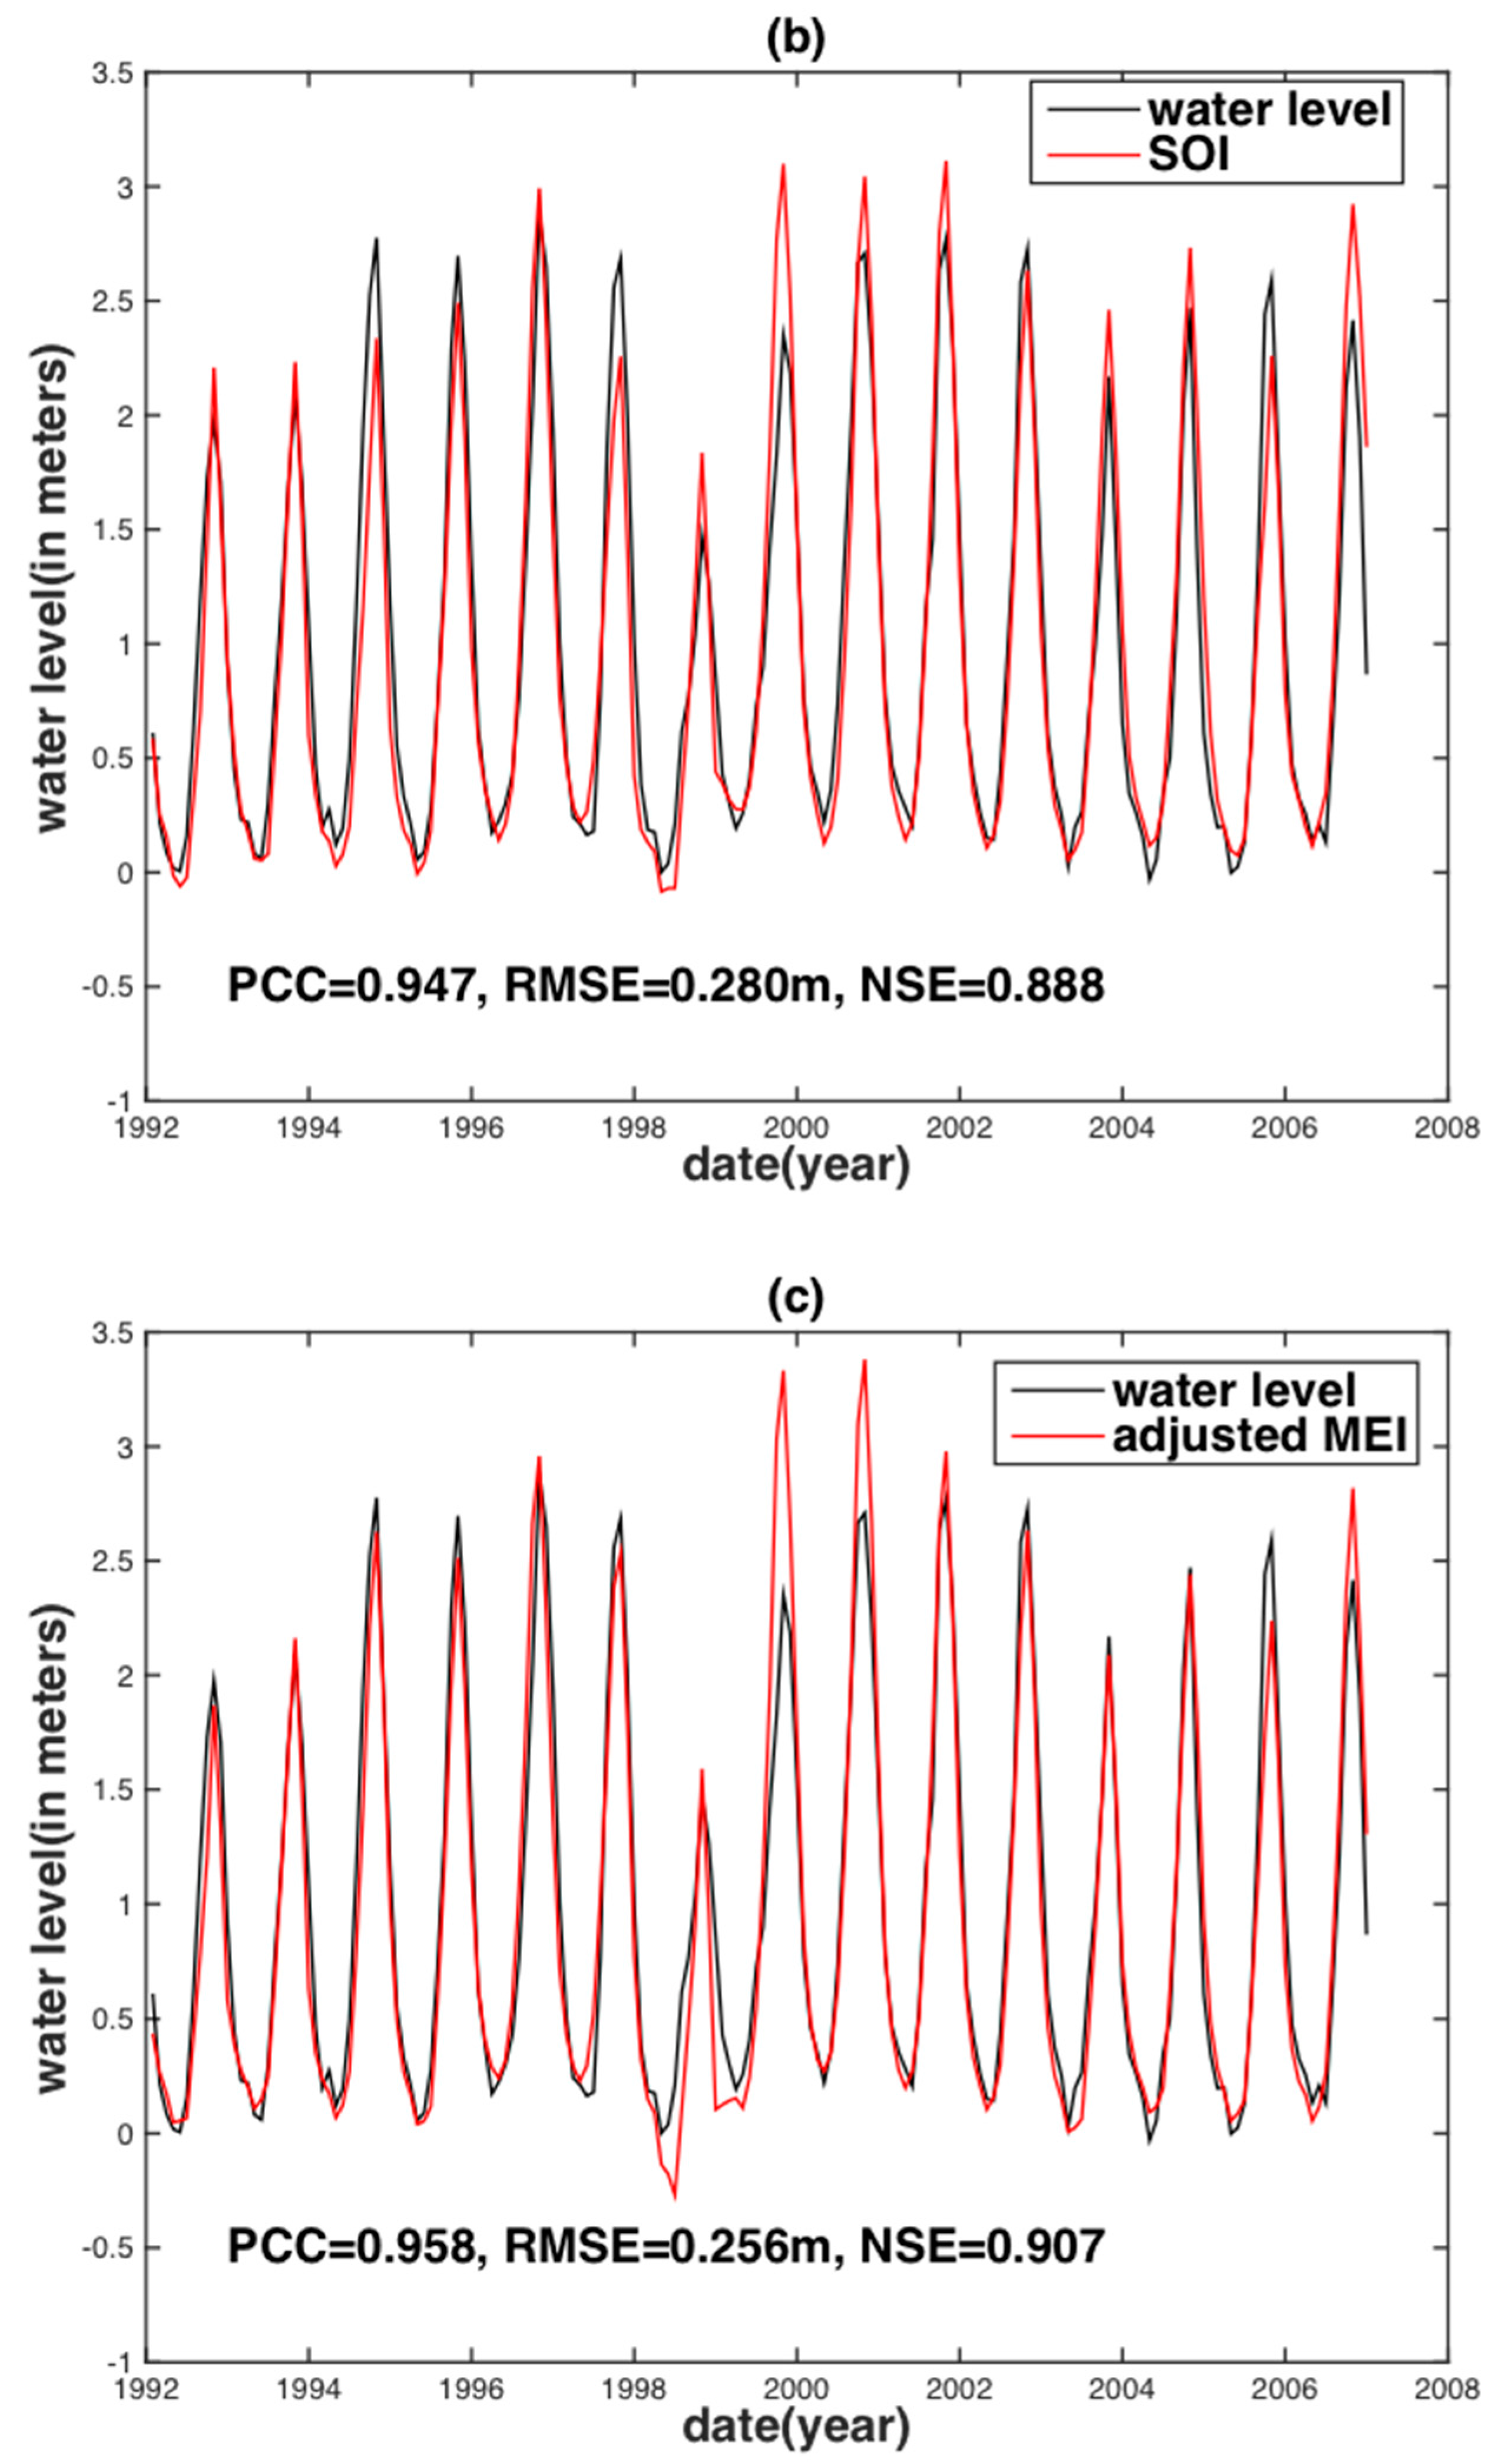
As ENSO events play an important role in the water level reconstruction of the above remote-sensing indices and PDSI, the water stages using the ENSO indices were reconstructed directly. Figure 8 shows that all ENSO indices performed well, but there are peak overestimations in the years 1999 and 2000. The ENSO-reconstructed results performed better during or after the 1991–1992 El Niño event than the results of or after the 1997–1998 El Niño event. This may be caused by the strong intensity of El Niño in 1997–1998, which had a considerable effect on the reconstruction of the water level. Besides the obvious overestimations in the years 1999 and 2000, other smaller peak disparities display a random pattern. In other words, the ENSO indices both overestimated or underestimated the water level in a random manner. This result may be due to the uneven distribution of rainfall affected by ENSO events. In addition, considering three types of ENSO indices, their degrees of peak overestimation in the years 1999 and 2000 are different. Compared to the SOI (for the atmosphere only), the water level overestimations are much larger when based on SST anomalies (for the ocean only) and MEI (for the coupled atmosphere–ocean). This indicates that the ocean is one of the significant factors causing the overestimation. Perhaps SST and MEI indices take into account some rainfall in the ocean region, which is outside our study region. Therefore, if we can find a way to remove the rainfall beyond our study region, the overestimations should be further mitigated.
The observed water stage for all the above results comes from the Vam Kenh station in the Mekong delta. The same procedure was applied to the Dinh An station independently, so as to demonstrate the applicability of our method in this study. To internally evaluate the reconstruction of various indices at two stations, the above-mentioned three assessment metrics, namely PCC, RMSE, and NSE in Section 3, were chosen as the performance criteria. In general, the reconstructed water level from the ENSO-assisted PDSI and ENSO indices performed better than the remote sensing indices (i.e., NDVI and LST), no matter whether in terms of the PCC, RMSE, and NSE (Table 2). This indicates that the causal information, based on the PDSI and ENSO, improves water level reconstruction. For the same index, the result for Vam Kenh is better than that for Dinh An, to which the topography and the proximity to the ocean may be attributed.
Among the three ENSO indices, the SST for ocean only performed best, the MEI for both ocean and atmosphere was second, and the SOI for the atmosphere only had the worst result. This implies that different ENSO indices may show different performances when projecting the hydrological conditions of a given basin, and the oceanic ENSO index based on SST is relatively effective in the Mekong basin.
In order to externally assess the suitability of our method, we based it on the constructed relationship between the water level from the Vam Kenh station and indices, and a scale factor simply obtained from the ratio of water discharge from two separated estuaries to predict the water level at the Dinh An station (hereafter called “Dinh An water level prediction” to distinguish it from “Dinh An water level reconstruction”). The result of the Dinh An water level prediction for the PDSI and ENSO-assisted water level prediction was slightly less accurate than the Dinh An water level reconstruction, while the prediction based on ENSO indices outperformed that of the reconstruction. However, the performance of the Dinh An water level prediction is still well represented (Table 2). Overall, our approach can not only reconstruct the water level at the gauged stations, but also predict the water level of an ungauged station based on information from another gauged station.
5. Conclusions
Contrary to the traditional usage of localized instantaneous measurement from remote sensing, we explore the feasibility of reconstructing the water level in the lower Mekong delta using PDSI, and three ENSO indices on a monthly temporal scale, for the reason that the causal information can serve as a precursor of localized instantaneous measurement. We found that the time lag (i.e., six months for 1991–1992 and nine months for 1997–1998) between standardized water levels and the PDSI and ENSO indices during the El Niño event is an important component for a better water level reconstruction, due to its ability to capture hydrological extremes.
Compared to remote sensing indices (i.e., NDVI and LST), PDSI- and ENSO-reconstructed water levels perform better. The combination of upstream and downstream PDSI (i.e., ENSO-assisted) and ENSO information obtained the best-reconstructed water level, which is fairly satisfactory with a correlation coefficient around 0.95, with an RMSE value ranging from 0.23 to 0.42 m and an NSE around 0.90. This compares to the reconstructions based on remote sensing with a correlation coefficient less than 0.90, with an RMSE value ranging from 0.40 to 0.79 m and an NSE less than 0.81, respectively. This result indicates that the potential usage of ENSO information could lead to an improvement in drought-index-based water level reconstruction and prediction. It is anticipated to be applicable to large basins affected by the ENSO phenomenon and hydrological extremes.
Notice that different ENSO indices may show different performance when projecting the hydrological conditions depending on the river basins, as El Niño poses a different magnitude of effect for different river basins. A holistic assessment for different river basins is yet necessary to further validate these results in the near future. Further improvement may lie in better temporal resolution of the PDSI and ENSO indices with good accuracy. To further extend our proposed method, an attempt can be made to use the environmental indices derived from climate model outputs for future water level projections. This can potentially help investigate whether the overestimation of potential evapotranspiration (PET) [56,57] has a substantial influence on water level reconstruction.
Acknowledgments
This research is partly supported by the National Natural Science Foundation of China (NSFC) (Grant No. 41374010; 41674007; 41429401) and the Hong Kong Baptist Faculty Research Grants (Grant No. FRG1/17-18/005; FRG2/16-17/082). The authors appreciate the Mekong River Commission (MRC) for providing historical water level data for this study.
Author Contributions
Hok Sum Fok collected the data, designed an initial concept and experiment, and performed analyses, interpretation and manuscript writing. Qing He performed post-processing data analyses and interpretation. Kwok Pan Chun provided initial data analysis techniques, guidance, and critical comments for this study. Zhiwei Zhou helped pre-process the remote sensing data. Thuan Chu provided initial technical support on remote sensing data exploration.
Conflicts of Interest
The authors declare no conflict of interest.
References
- Postel, S.L.; Daily, G.C.; Ehrlich, P.R. Human appropriation of renewable fresh water. Science 1996, 271, 785–788. [Google Scholar] [CrossRef]
- Coe, M.T.; Birkett, C.M. Calculation of river discharge and prediction of lake height from satellite radar altimetry: Example for the Lake Chad basin. Water Resour. Res. 2004, 40. [Google Scholar] [CrossRef]
- Alsdorf, D.E.; Rodriguez, E.; Lettenmaier, D.P. Measuring surface water from space. Rev. Geophys. 2007, 45. [Google Scholar] [CrossRef]
- Jung, H.C.; Alsdorf, D.; Moritz, M.; Lee, H.; Vassolo, S. Analysis of the relationship between flooding area and water height in the Logone floodplain. Phys. Chem. Earth Parts A/B/C 2011, 36, 232–240. [Google Scholar] [CrossRef]
- Song, C.; Ye, Q.; Sheng, Y.; Gong, T. Combined ICESat and CryoSat-2 altimetry for accessing water level dynamics of Tibetan Lakes over 2003–2014. Water 2015, 7, 4685–4700. [Google Scholar] [CrossRef]
- Vörösmarty, C.; Willmott, C.J.; Choudhury, B.J.; Schloss, A.L.; Steams, T.K.; Robeson, S.M.; Dorman, T.J. Analyzing the discharge regime of a large tropical river through remote sensing, ground-based climatic data, and modeling. Water Resour. Res. 1996, 32, 3137–3150. [Google Scholar] [CrossRef]
- Vörösmarty, C.; Askew, A.; Grabs, W.; Barry, R.; Birkett, C.; Döll, P.; Goodison, B.; Hall, A.; Jenne, R.; Kitaev, L. Global water data: A newly endangered species. Eos Trans. Am. Geophys. Union 2001, 82, 54–58. [Google Scholar] [CrossRef]
- Alsdorf, D.E.; Lettenmaier, D.P. Tracking fresh water from space. Science 2003, 301, 1491–1494. [Google Scholar] [CrossRef] [PubMed]
- Smith, L.C. Satellite remote sensing of river inundation area, stage, and discharge: A review. Hydrol. Process. 1997, 11, 1427–1439. [Google Scholar] [CrossRef]
- Pan, F.; Nichols, J. Remote sensing of river stage using the cross-sectional inundation area-river stage relationship (IARSR) constructed from digital elevation model data. Hydrol. Process. 2013, 27, 3596–3606. [Google Scholar] [CrossRef]
- Tang, Q.; Gao, H.; Lu, H.; Lettenmaier, D.P. Remote sensing: Hydrology. Prog. Phys. Geogr. 2009, 33, 490–509. [Google Scholar] [CrossRef]
- Liu, R.; Li, J.; Fok, H.S.; Shum, C.; Li, Z. Earth surface deformation in the north China plain detected by joint analysis of GRACE and GPS data. Sensors 2014, 14, 19861–19876. [Google Scholar] [CrossRef] [PubMed]
- Fok, H.S. Ocean Tides Modeling Using Satellite Altimetry. Ph.D. Thesis, The Ohio State University, Columbus, OH, USA, 2012. [Google Scholar]
- Palmer, W.C. Meteorological Drought; Weather Bureau: Washington, DC, USA, 1965; Volume 30. [Google Scholar]
- Räsänen, T.A.; Kummu, M. Spatiotemporal influences of ENSO on precipitation and flood pulse in the Mekong River Basin. J. Hydrol. 2013, 476, 154–168. [Google Scholar] [CrossRef]
- Kiem, A.S.; Hapuarachchi, H.P.; Ishidaira, H.; Magome, J.; Takeuchi, K. Uncertainty in hydrological predictions due to inadequate representation of climate variability impacts. In Proceedings of the AOGS 1st Annual Meeting & APHW 2nd Conference, Singapore, 5–9 July 2004. [Google Scholar]
- Xue, Z.; Liu, J.P.; Ge, Q. Changes in hydrology and sediment delivery of the Mekong River in the last 50 years: Connection to damming, monsoon, and ENSO. Earth Surf. Process. Landf. 2011, 36, 296–308. [Google Scholar] [CrossRef]
- Wooldridge, S.A.; Franks, S.W.; Kalma, J.D. Hydrological implications of the Southern Oscillation: Variability of the rainfall-runoff relationship. Hydrol. Sci. J. 2001, 46, 73–88. [Google Scholar] [CrossRef]
- Li, S.; He, D. Water level response to hydropower development in the upper Mekong River. AMBIO J. Hum. Environ. 2008, 37, 170–176. [Google Scholar] [CrossRef]
- Tong, J.; Qiang, Z.; Deming, Z.; Yijin, W. Yangtze floods and droughts (China) and teleconnections with ENSO activities (1470–2003). Quat. Int. 2006, 144, 29–37. [Google Scholar] [CrossRef]
- Xu, J.; Ren, L.L.; Ruan, X.H.; Liu, X.F.; Yuan, F. Development of a physically based PDSI and its application for assessing the vegetation response to drought in northern China. J. Geophys. Res. Atmos. 2012, 117. [Google Scholar] [CrossRef]
- Dai, A.; Trenberth, K.E.; Qian, T. A global dataset of Palmer Drought Severity Index for 1870–2002: Relationship with soil moisture and effects of surface warming. J. Hydrometeorol. 2004, 5, 1117–1130. [Google Scholar] [CrossRef]
- Dettinger, M.D.; Diaz, H.F. Global characteristics of stream flow seasonality and variability. J. Hydrometeorol. 2000, 1, 289–310. [Google Scholar] [CrossRef]
- Kiem, A.S.; Franks, S.W. On the identification of ENSO-induced rainfall and runoff variability: A comparison of methods and indices. Hydrol. Sci. J. 2001, 46, 715–727. [Google Scholar] [CrossRef]
- Liu, W.; Juárez, R.N. ENSO drought onset prediction in northeast Brazil using NDVI. Int. J. Remote Sens. 2001, 22, 3483–3501. [Google Scholar] [CrossRef]
- Sheffield, J.; Wood, E.F. Global trends and variability in soil moisture and drought characteristics, 1950–2000, from observation-driven simulations of the terrestrial hydrologic cycle. J. Clim. 2008, 21, 432–458. [Google Scholar] [CrossRef]
- Yao, S.; Huang, Q.; Zhao, C. Variation Characteristics of Rainfall in the Pre-Flood Season of South China and Its Correlation with Sea Surface Temperature of Pacific. Atmosphere 2015, 7, 5. [Google Scholar] [CrossRef]
- Kiem, A.S.; Geogievsky, M.V.; Hapuarachchi, H.P.; Ishidaira, H.; Takeuchi, K. Relationship between ENSO and snow covered area in the Mekong and Yellow River basins. Reg. Hydrol. Impacts Clim. Chang. Hydroclim. Var. 2005, 2, 255–264. [Google Scholar]
- Räsänen, T. Hydrological Changes in the Mekong River Basin—The Effects of Climate Variability and Hydropower Development. Ph.D. Thesis, Aalto University, Helsinki, Finland, 2014. [Google Scholar]
- Räsänen, T.; Lehr, C.; Mellin, I.; Ward, P.; Kummu, M. Palaeoclimatological perspective on river basin hydrometeorology: Case of the Mekong Basin. Hydrol. Earth Syst. Sci. 2013, 17, 2069–2081. [Google Scholar] [CrossRef]
- Yimei, C. Drought Analysis of Yunnan Province Based on PDSI Index. Water Resour. Power 2013, 31, 5–7. (In Chinese) [Google Scholar]
- Thilakarathne, M.; Sridhar, V. Characterization of future drought conditions in the Lower Mekong River Basin. Weather Clim. Extrem. 2017, 17, 47–58. [Google Scholar] [CrossRef]
- Tucker, C.J. Red and photographic infrared linear combinations for monitoring vegetation. Remote Sens. Environ. 1979, 8, 127–150. [Google Scholar] [CrossRef]
- Forsythe, N.; Kilsby, C.G.; Fowler, H.J.; Archer, D.R. Assessment of runoff sensitivity in the Upper Indus Basin to interannual climate variability and potential change using MODIS satellite data products. Mt. Res. Dev. 2012, 32, 16–29. [Google Scholar] [CrossRef]
- Mekong River Commission (MRC). Overview of the Hydrology of the Mekong Basin; Mekong River Commission: Vientiane, Laos, 2005; p. 73. [Google Scholar]
- Gupta, A.; Liew, S.C. The Mekong from satellite imagery: A quick look at a large river. Geomorphology 2007, 85, 259–274. [Google Scholar] [CrossRef]
- Yasunari, T. Impact of Indian monsoon on the coupled atmosphere/ocean system in the tropical Pacific. Meteorol. Atmos. Phys. 1990, 44, 29–41. [Google Scholar] [CrossRef]
- Lau, N.-C.; Wang, B. Interactions between the Asian monsoon and the El Niño/Southern oscillation. In The Asian Monsoon; Springer: Berlin/Heidelberg, Germany, 2006; pp. 479–512. [Google Scholar]
- Wang, B.; Wu, R.; Lau, K. Interannual variability of the Asian summer monsoon: Contrasts between the Indian and the western North Pacific–East Asian monsoons. J. Clim. 2001, 14, 4073–4090. [Google Scholar] [CrossRef]
- Wu, R.; Wang, B. A contrast of the East Asian summer monsoon–ENSO relationship between 1962–77 and 1978–93. J. Clim. 2002, 15, 3266–3279. [Google Scholar] [CrossRef]
- Juneng, L.; Tangang, F.T. Evolution of ENSO-related rainfall anomalies in Southeast Asia region and its relationship with atmosphere–ocean variations in Indo-Pacific sector. Clim. Dyn. 2005, 25, 337–350. [Google Scholar] [CrossRef]
- Webster, P.J.; Yang, S. Monsoon and ENSO: Selectively interactive systems. Q. J. R. Meteorol. Soc. 1992, 118, 877–926. [Google Scholar] [CrossRef]
- Delgado, J.; Merz, B.; Apel, H. A climate-flood link for the lower Mekong River. Hydrol. Earth Syst. Sci. 2012, 16, 1533. [Google Scholar] [CrossRef] [Green Version]
- Justice, C.O.; Vermote, E.; Townshend, J.R.; Defries, R.; Roy, D.P.; Hall, D.K.; Salomonson, V.V.; Privette, J.L.; Riggs, G.; Strahler, A. The Moderate Resolution Imaging Spectroradiometer (MODIS): Land remote sensing for global change research. IEEE Trans. Geosci. Remote Sens. 1998, 36, 1228–1249. [Google Scholar] [CrossRef]
- Heim, R.R., Jr. A review of twentieth-century drought indices used in the United States. Bull. Am. Meteorol. Soc. 2002, 83, 1149–1165. [Google Scholar]
- Rasmusson, E.M.; Carpenter, T.H. Variations in tropical sea surface temperature and surface wind fields associated with the Southern Oscillation/El Niño. Mon. Weather Rev. 1982, 110, 354–384. [Google Scholar] [CrossRef]
- Fu, C.; Diaz, H.; Fletcher, J. Characteristics of the response of sea surface temperature in the central Pacific associated with warm episodes of the Southern Oscillation. Mon. Weather Rev. 1986, 114, 1716–1739. [Google Scholar] [CrossRef]
- Kao, H.-Y.; Yu, J.-Y. Contrasting eastern-Pacific and central-Pacific types of ENSO. J. Clim. 2009, 22, 615–632. [Google Scholar] [CrossRef]
- Linage, C.; Kim, H.; Famiglietti, J.S.; Yu, J.Y. Impact of Pacific and Atlantic sea surface temperatures on interannual and decadal variations of GRACE land water storage in tropical South America. J. Geophys. Res. Atmos. 2013, 118. [Google Scholar] [CrossRef]
- Xu, J.; Chan, J.C. The role of the Asian–Australian monsoon system in the onset time of El Niño events. J. Clim. 2001, 14, 418–433. [Google Scholar] [CrossRef]
- Xu, W.; Wang, W.; Ma, J.; Xu, D. ENSO events during 1951–2007 and their characteristic indices. J. Nat. Dis. 2009, 18, 18–24. (In Chinese) [Google Scholar]
- Wang, H.; Yang, Z.; Saito, Y.; Liu, J.P.; Sun, X. Interannual and seasonal variation of the Huanghe (Yellow River) water discharge over the past 50 years: Connections to impacts from ENSO events and dams. Glob. Planet. Chang. 2006, 50, 212–225. [Google Scholar] [CrossRef]
- Kim, S.; Son, H.-Y.; Kug, J.-S. Relative roles of equatorial central Pacific and western North Pacific precipitation anomalies in ENSO teleconnection over the North Pacific. Clim. Dyn. 2017. [Google Scholar] [CrossRef]
- Nazemi, A.; Wheater, H.S.; Chun, K.P.; Bonsal, B.; Mekonnen, M. Forms and drivers of annual streamflow variability in the headwaters of Canadian Prairies during the 20th century. Hydrol. Process. 2017, 31, 221–239. [Google Scholar] [CrossRef]
- Nash, J.E.; Sutcliffe, J.V. River flow forecasting through conceptual models part I—A discussion of principles. J. Hydrol. 1970, 10, 282–290. [Google Scholar] [CrossRef]
- Milly, P.C.; Dunne, K.A. Potential evapotranspiration and continental drying. Nat. Clim. Chang. 2016, 6, 946–949. [Google Scholar] [CrossRef]
- Lofgren, B.M.; Rouhana, J. Physically Plausible Methods for Projecting Changes in Great Lakes Water Levels under Climate Change Scenarios. J. Hydrometeorol. 2016, 17, 2209–2223. [Google Scholar] [CrossRef]
Figure 1.
Map of the lower Mekong River Basin (a) with all stations in red triangles (that have discharge and water level measurements) and (b) selected stations (with water level measurements) situated near the river mouth in this study due to longer data time series.
Figure 1.
Map of the lower Mekong River Basin (a) with all stations in red triangles (that have discharge and water level measurements) and (b) selected stations (with water level measurements) situated near the river mouth in this study due to longer data time series.

Figure 2.
Time series of water level at the Dinh An (blue) station and Vam Kenh (red) station.

Figure 3.
Time series of SOI (a), SST anomalies in the Niño 3.4 region (b) and MEI (c). Red, blue and green bars indicate El Niño events, La Niña events and neutral parts, respectively.
Figure 3.
Time series of SOI (a), SST anomalies in the Niño 3.4 region (b) and MEI (c). Red, blue and green bars indicate El Niño events, La Niña events and neutral parts, respectively.

Figure 4.
Time series of water levels in the Vam Kenh station arranged by year (a), and the water level anomaly in standardized form against the PDSI value (b,d) and negative SST anomaly value (c,e). The left side are the time series comparisons of PDSI and negative SST, and the right side are their scatter plots.


Figure 5.
The water level from the Vam Kenh anomaly in the standardized form against the negative SST anomaly (a,d), SOI (b,e) and MEI value (c,f) after the shift processing. The left side are the time series comparisons of the three indices, and the right side are their scatter plots.
Figure 5.
The water level from the Vam Kenh anomaly in the standardized form against the negative SST anomaly (a,d), SOI (b,e) and MEI value (c,f) after the shift processing. The left side are the time series comparisons of the three indices, and the right side are their scatter plots.


Figure 6.
Water level reconstruction at the Vam Kenh station based on NDVI (a) and negative LST (b).
Figure 6.
Water level reconstruction at the Vam Kenh station based on NDVI (a) and negative LST (b).

Figure 7.
The water level reconstruction at the Vam Kenh station based on the downstream PDSI (a) and ENSO-assisted PDSI (b).
Figure 7.
The water level reconstruction at the Vam Kenh station based on the downstream PDSI (a) and ENSO-assisted PDSI (b).

Figure 8.
The water level reconstruction at the Vam Kenh station based on ENSO indices including negative SST anomalies in Niño 3.4 (a), SOI (b) and MEI (c).
Figure 8.
The water level reconstruction at the Vam Kenh station based on ENSO indices including negative SST anomalies in Niño 3.4 (a), SOI (b) and MEI (c).


Table 1.
Intensity indicators of El Niño and La Niña [51].
Table 1.
Intensity indicators of El Niño and La Niña [51].
| Index | Very Weak | Weak | Medium | Strong | Very Strong |
|---|---|---|---|---|---|
| SST | <0.78 | 0.78–1.06 | 1.06–1.62 | 1.62–1.90 | >1.90 |
Table 2.
Internal and external assessment of observed water levels and reconstructed water levels derived from various indices at the Vam Kenh, Dinh An and Dinh An station predicted by Vam Kenh. The third part means we used Vam Kenh data and various indices to reconstruct the water level for Dinh An station. PDSI (before) represents using the PDSI only to reconstruct water levels, while the PDSI (after) stands for ENSO-assisted PDSI.
| Station | Index | PCC | RMSE (m) | NSE | |
|---|---|---|---|---|---|
| Vam Kenh | Remote sensing indices | NDVI | 0.838 | 0.467 | 0.703 |
| LST | 0.881 | 0.405 | 0.776 | ||
| Drought index | PDSI (before) | 0.957 | 0.253 | 0.909 | |
| PDSI (after) | 0.962 | 0.228 | 0.926 | ||
| ENSO indices | SST | 0.958 | 0.249 | 0.912 | |
| SOI | 0.947 | 0.280 | 0.888 | ||
| MEI | 0.958 | 0.256 | 0.907 | ||
| Dinh An | Remote sensing indices | NDVI | 0.835 | 0.762 | 0.697 |
| LST | 0.900 | 0.602 | 0.811 | ||
| Drought index | PDSI (before) | 0.951 | 0.403 | 0.898 | |
| PDSI (after) | 0.958 | 0.370 | 0.914 | ||
| ENSO indices | SST | 0.960 | 0.375 | 0.912 | |
| SOI | 0.948 | 0.423 | 0.887 | ||
| MEI | 0.958 | 0.395 | 0.902 | ||
| Dinh An predicted by Vam Kenh | Remote sensing indices | NDVI | 0.835 | 0.787 | 0.677 |
| LST | 0.900 | 0.645 | 0.783 | ||
| Drought index | PDSI (before) | 0.941 | 0.438 | 0.879 | |
| PDSI (after) | 0.952 | 0.402 | 0.898 | ||
| ENSO indices | SST | 0.961 | 0.355 | 0.921 | |
| SOI | 0.947 | 0.409 | 0.895 | ||
| MEI | 0.961 | 0.353 | 0.922 | ||
© 2018 by the authors. Licensee MDPI, Basel, Switzerland. This article is an open access article distributed under the terms and conditions of the Creative Commons Attribution (CC BY) license (http://creativecommons.org/licenses/by/4.0/).
Share and Cite
MDPI and ACS Style
Fok, H.S.; He, Q.; Chun, K.P.; Zhou, Z.; Chu, T. Application of ENSO and Drought Indices for Water Level Reconstruction and Prediction: A Case Study in the Lower Mekong River Estuary. Water 2018, 10, 58. https://doi.org/10.3390/w10010058
AMA Style
Fok HS, He Q, Chun KP, Zhou Z, Chu T. Application of ENSO and Drought Indices for Water Level Reconstruction and Prediction: A Case Study in the Lower Mekong River Estuary. Water. 2018; 10(1):58. https://doi.org/10.3390/w10010058
Chicago/Turabian StyleFok, Hok Sum, Qing He, Kwok Pan Chun, Zhiwei Zhou, and Thuan Chu. 2018. "Application of ENSO and Drought Indices for Water Level Reconstruction and Prediction: A Case Study in the Lower Mekong River Estuary" Water 10, no. 1: 58. https://doi.org/10.3390/w10010058
Note that from the first issue of 2016, this journal uses article numbers instead of page numbers. See further details here.