Spatial and Seasonal Patterns of Nutrients and Heavy Metals in Twenty-Seven Rivers Draining into the South China Sea


1
Wuhan Library and Intelligence Centre of the Chinese Academy of Sciences, Wuhan 430071, China
2
Guangdong Key Laboratory for Innovative Development and Utilization of Forest Plant Germplasm, College of Forestry and Landscape Architecture, South China Agricultural University, Guangzhou 510642, China
3
Key Laboratory of Aquatic Botany and Watershed Ecology, Wuhan Botanical Garden, Chinese Academy of Sciences, Wuhan 430074, China
*
Author to whom correspondence should be addressed.
†
The first two authors contributed equally to this work.
Water 2018, 10(1), 50; https://doi.org/10.3390/w10010050
Submission received: 10 November 2017
/
Revised: 5 January 2018
/
Accepted: 7 January 2018
/
Published: 10 January 2018
(This article belongs to the Special Issue Recent Progress in River Biogeochemistry Research)
Abstract
:Due to the acceleration of industrialization and urbanization in recent decades, the majority of coastal rivers and estuaries in China have been moderately or severely contaminated by a variety of pollutants. We investigated the spatial and seasonal variations of water nutrients (permanganate index, chemical oxygen demand, biochemical oxygen demand, ammonium, nitrate, total nitrogen, and total phosphorus) and heavy metals (Hg, Pb, Cu, Zn, Se, As, Cd, Cr, Fe, and Mn) in 27 subtropical rivers draining into the South China Sea. Our results indicated that the average concentrations of all water quality parameters except ammonium, total nitrogen, and total phosphorus satisfied the requirements for grade III of the surface water quality standard of China. The concentrations of both nutrients and heavy metals showed a strong spatial variation. Cluster analysis classified the 27 rivers into three spatial clusters corresponding to low, moderate, and high pollution levels. In terms of seasonal variation, the values of chemical oxygen demand and biochemical oxygen demand in wet seasons were significantly lower than those in dry seasons. Multivariate statistical analyses demonstrated that river nutrients might mainly originate from domestic, industrial, and agricultural wastewaters, while heavy metals likely came from industrial activities and natural weathering processes. The findings of this study suggest that for reducing the pollution of subtropical rivers draining into the South China Sea, further efforts should be made to control nitrogen and phosphorus export from catchments.
1. Introduction
Water quality plays a critical role in determining the ecological conditions and functions of aquatic habitats [1,2]. Excess nutrients and heavy metals in rivers are considered to be the major environmental problems in many countries, and especially in China [3,4,5,6]. Eutrophication, characterized by excessive growth of algae and other aquatic plants, is a common consequence of nitrogen (N) and phosphorus (P) enrichment in rivers and streams [7,8]. Water quality degradation can also result in many other ecological problems such as a reduction of aquatic biodiversity, the mortality of benthic communities, and fish deaths [9,10]. In addition, heavy metals can accumulate in the human body via the food chain and lead to serious damage to the nervous system and internal organs [11,12,13,14].
Increased delivery of nutrients and heavy metals to coastal oceans through river channels has been recognized as a major threat to the structure and function of continental shelf ecosystems [15]. N and P pollution is now the largest environmental issue in the estuaries and coastal areas of several countries (e.g., the United States and China) and is likely to increase due to intensive use of inorganic fertilizers and fossil fuels [16,17]. In China, the coastal waters have received a large amount of nutrients and heavy metals from rivers because of the rapid economic development and population growth during the past 30 years [18]. A recent study has indicated that the risk for harmful algal blooms in the coastal seas of China may increase in the next half-century due to eutrophication [19].
Nutrients and heavy metals enter the river waters from a wide range of anthropogenic and natural sources in the catchments, such as industrial effluent, domestic sewage, and agricultural runoff [9,20]. Identifying the possible sources of nutrients and heavy metals in river waters is essential for developing a targeted strategy to reduce the negative effects of pollutants on environments and organisms. In the last two decades, multivariate statistical techniques, such as cluster analysis (CA), principal component analysis (PCA), and correlation analysis, have been frequently employed to investigate the spatial–temporal variations of water quality and to identify the possible sources of pollutants in river waters [21,22,23,24].
The South China Sea is one of the largest marginal seas in the world, with a surface area of 3.5 × 10⁶ km2 [25]. There are a large number of subtropical rivers draining into the South China Sea in the province of Guangdong, where industrialization and urbanization have reached high levels [19]. However, until now, few studies have been performed to investigate the spatial and seasonal variations of water quality in these subtropical rivers of South China [26,27]. In this study, we determined the concentrations of 17 nutrient and heavy metal parameters in 27 rivers draining into the South China Sea for every month in 2015. We presented a hypothesis that water quality in rivers might show a significant spatial variation because of differences in catchment characteristics such as industrial development and urbanization. We also hypothesized that due to the dilution effect caused by rainfall and flooding, the concentrations of both nutrients and heavy metals in wet seasons would be significantly lower than those in dry seasons. The objectives of this study were (1) to assess the overall water quality of the studied rivers; (2) to explore the spatial and seasonal pattern of nutrients and heavy metals in river waters; and (3) to examine the possible sources of nutrients and heavy metals using multivariate statistical analyses.
2. Materials and Methods
2.1. Study Area
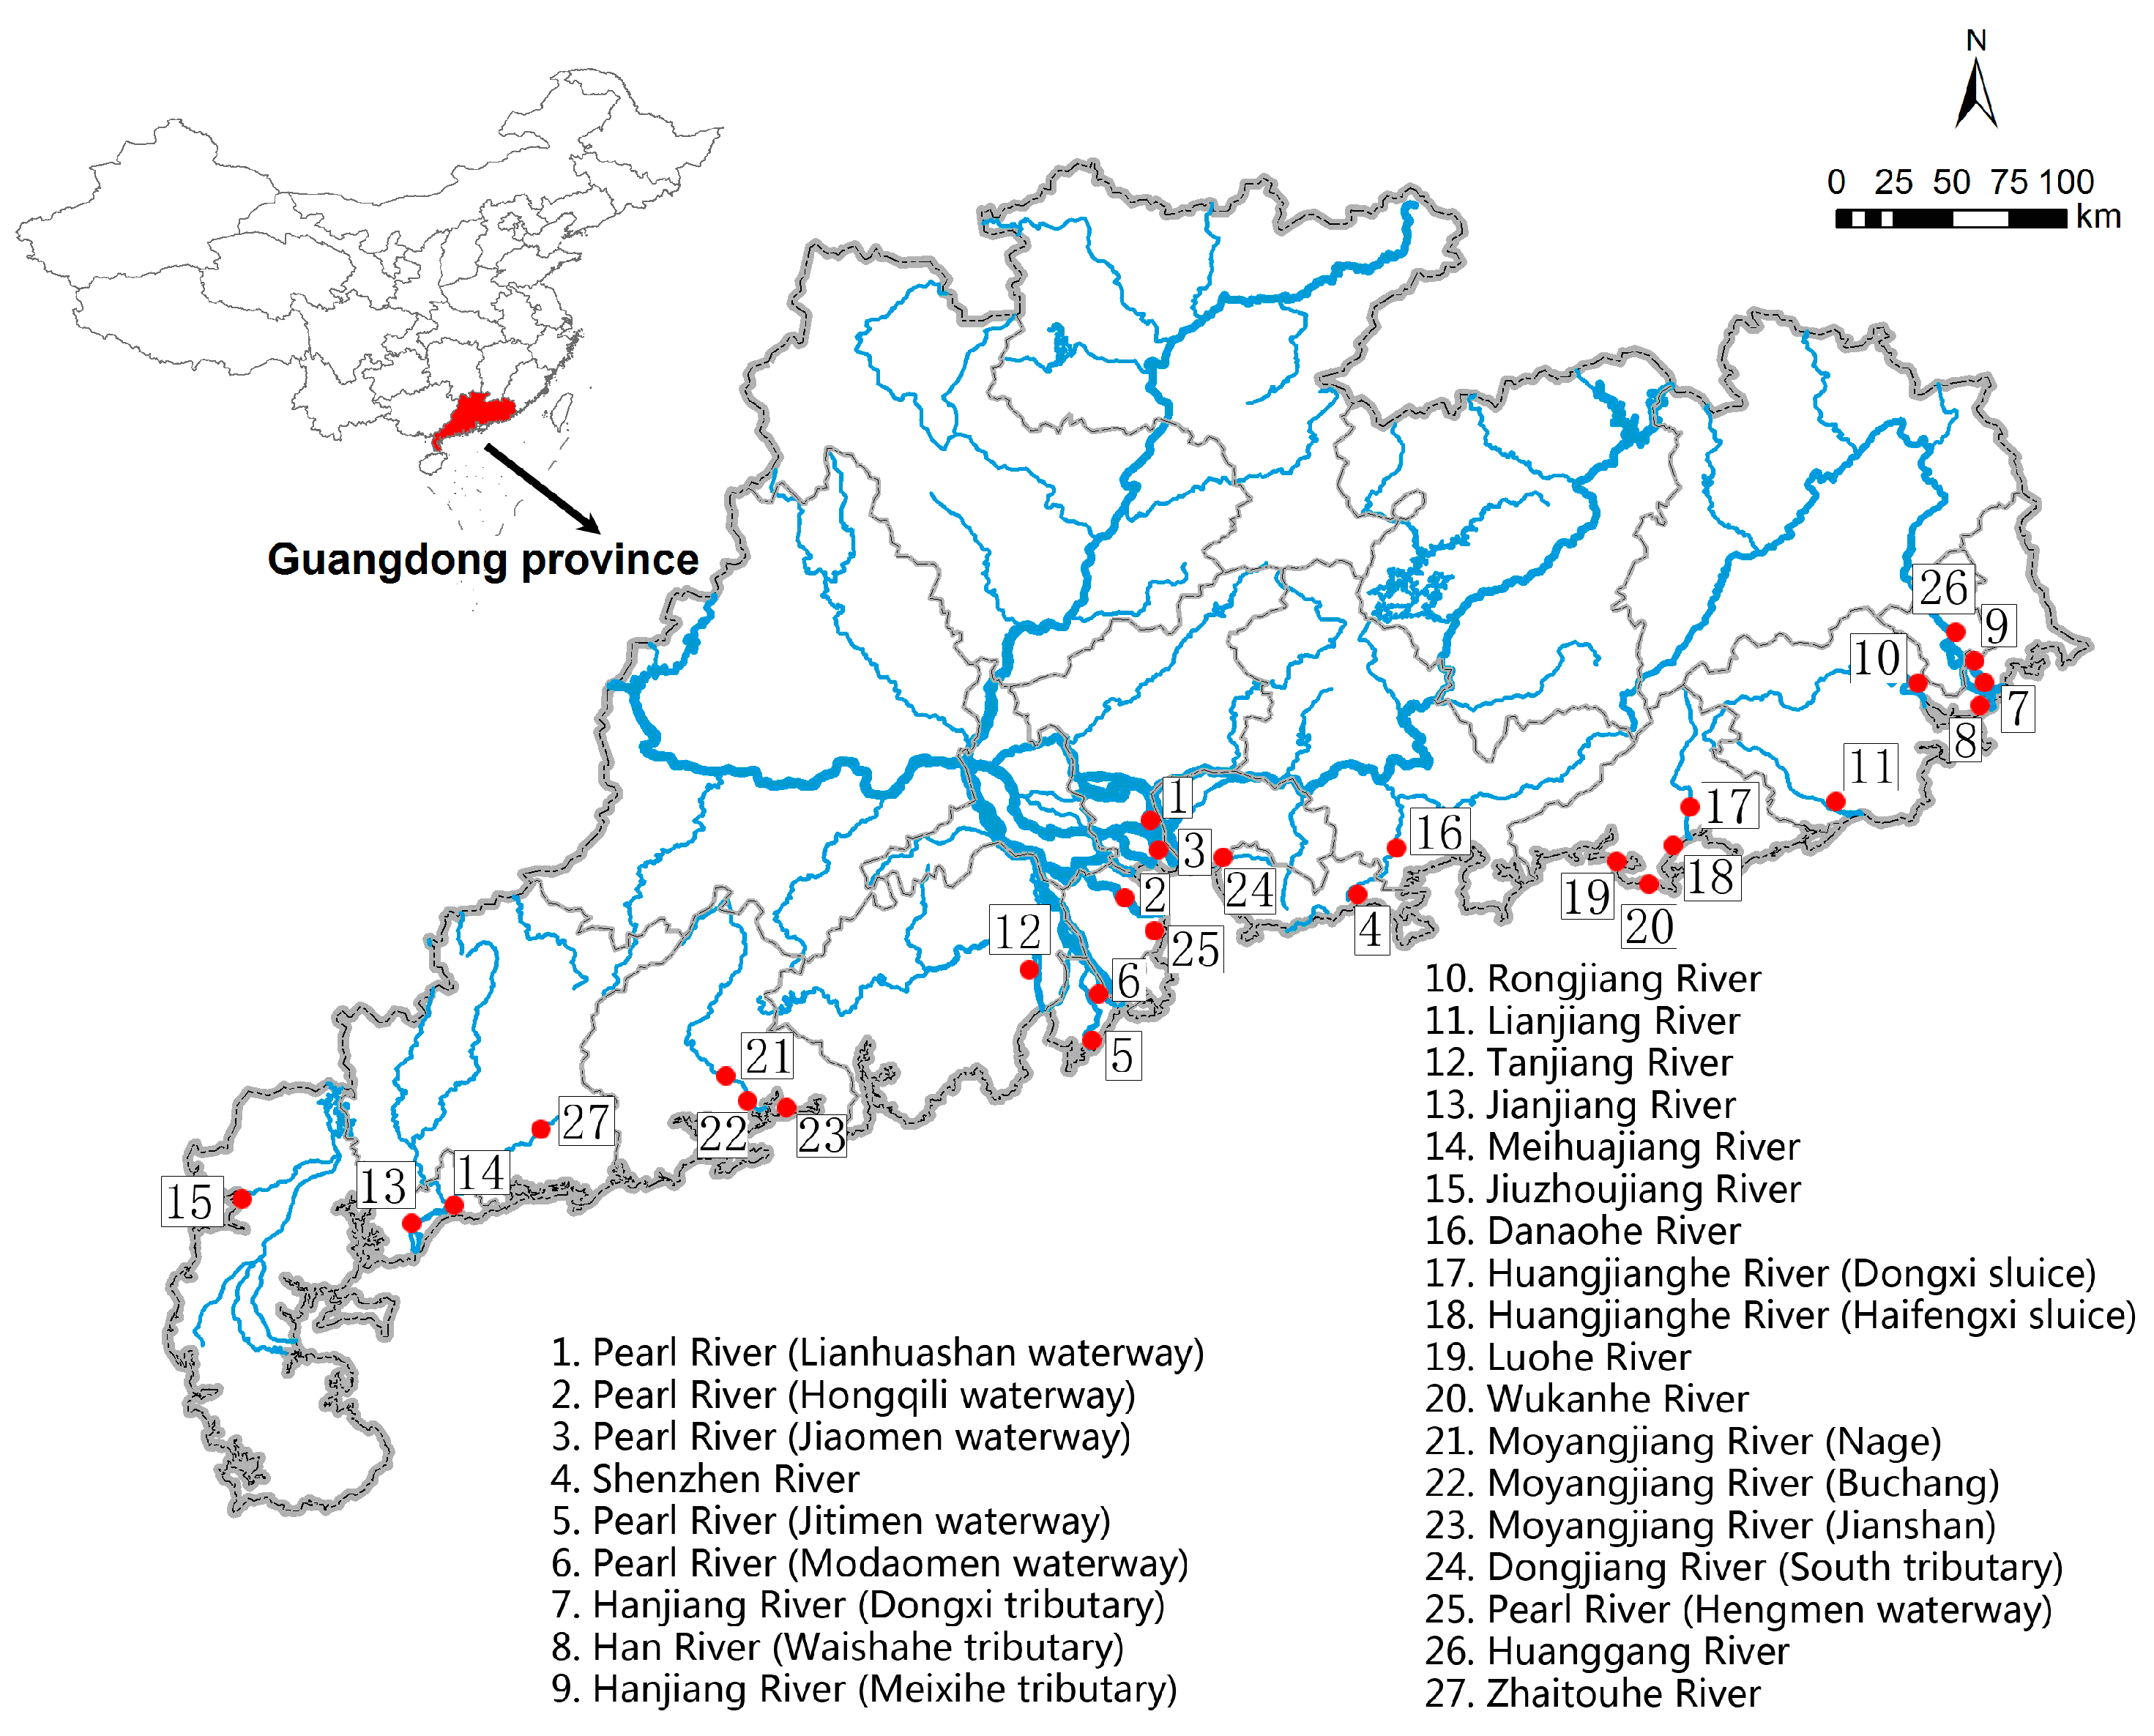
In the Guangdong province of China, there are 1314 rivers and streams, many of which belong to the Pearl River basin and finally enter into the South China Sea (Figure 1). These rivers and streams play an important role in providing fresh water for industrial, domestic, and agricultural uses in rural areas and cities such as Guangzhou, Shenzhen, and Hong Kong. However, the water quality of these rivers and streams has deteriorated considerably in recent decades and shows strong spatial and temporal variations [26,27] due to rapid economic growth and urban development in catchments. The government report has shown that water pollution is still a serious problem in the Guangdong province and approximately 22.6% of river sections have a water quality worse than Grade III of the environmental quality standards for surface water in China [28].
In 2015, the Guangdong province had a gross domestic product (GDP) of 1169 billion US Dollars and a population of approximately 107 million people. The Guangdong province is characterized by a subtropical monsoon climate, where the annual average temperature is about 21.8 °C. The mean annual precipitation in these areas is over 1789 mm, and approximately 85% of the total rainfall is concentrated in the rainy season from April to September. In the coastal areas of Guangdong province, the topography is relatively flat and the land use is predominantly industrial and urban [29]. After the opening and reform policy in the late 1970s, the coastal areas have developed faster than the inland regions and have become one of the most developed areas in China.
2.2. Water Sampling and Analytical Methods
An environmental monitoring system has been set up to monitor the water quality and pollutant fluxes of 27 large rivers draining into the South China Sea in the Guangdong Province. For each river, we established one monitoring station at a site near the river mouth (Figure 1). Replicated samples of surface water (approximately 0.5 m depth) were collected monthly from January to December 2015 in the channel center from a boat or by wading if the water depth was less than 1 m. Pre-treatment methods including acidification and filtration have been described in detail in our previous study [11]. For the purpose of this study, the monthly data of 17 nutrient and heavy metal variables from 27 monitoring rivers during 2015 were determined. The nutrient parameters included permanganate index (IMn), chemical oxygen demand (COD), 5-day biochemical oxygen demand (BOD5), ammonium (NH4+), nitrate (NO3−), total nitrogen (TN), and total phosphorus (TP). The heavy metal variables included mercury (Hg), lead (Pb), copper (Cu), zinc (Zn), selenium (Se), arsenic (As), cadmium (Cd), chromium (Cr), iron (Fe), and manganese (Mn).
The nutrient parameters and heavy metal variables were determined in the laboratory using standard methods recommended by the State Environmental Protection Administration of China. The specific method used to determine nutrient parameters is presented as follows: IMn, acidic potassium permanganate method; COD, Dichromate method; BOD5, dilution and seeding method; NH4+, salicylic acid method; NO3−, phenol disulfonic acid method; TN, alkaline potassium persulfate digestion method; and TP, ammonium molybdate method. The Hg and As concentrations were determined by cold atomic fluorescence spectrometry, while the levels of Pb, Cu, Zn and Cd were measured by atomic absorption spectrophotometry. The Se and Cr concentrations were measured using the graphite furnace atomic absorption spectrometric method and the diphenylcarbohydrazide spectrophotometric method, respectively. In addition, the Fe and Mn concentrations were measured by the flame atomic absorption spectrometric method. The details of these methods have been described elsewhere [11,30]. The detection limits or accuracy of these standard methods have been given in the environmental quality standards for surface water in China (GB3838-2002). For instance, the detect limits of Zn and Pb were 0.05 and 0.01 mg/L, respectively.
2.3. Statistical Analyses
We checked the data for normal distributions using the Shapiro–Wilk test before statistical analyses. Non-normally distributed data were subjected to logarithmic or square root transformations. To evaluate the overall water quality of these studied rivers, we used the environmental quality standards for surface water in China (GB3838-2002) which divided the water quality into five grades (I–V) in accordance with the environmental functions and protective objectives [31]. The grades I and V corresponded to the best and worst water quality, respectively. The grade III was frequently used in assessing the water quality in China [31] because it indicated the water was suitable for fish, aquaculture, and swimming.
Hierarchical cluster analysis (CA) using the squared Euclidean distance was applied to group the 27 studied rivers into several spatial clusters by the similarity of water quality parameters [4]. To examine the seasonal pattern of river water quality, we classified the 12 months into wet season (from April to September) and dry season (from October to the next March) according to monthly precipitation in Guangdong Province. Differences in the nutrient and heavy metal concentrations between spatial clusters and between the sampling seasons were investigated by independent-samples t-tests.
Principal component analysis (PCA) using the varimax rotation method was used to identify the possible sources of nutrients and heavy metals in river waters [3,32]. The number of principal components was selected based on Kaiser’s rule, which only retained eigenvectors with an eigenvalue greater than one [4]. In addition, relationships between nutrient and heavy metal concentrations were assessed by Pearson correlation analysis, which was also widely used to determine the possible sources of pollutants [33]. The software PASW Statistics 18 (IBM SPSS Inc., Chicago, IL, USA) was used to perform the above statistical analyses.
3. Results
3.1. Overall Assessment of River Water Quality
According to the environmental quality standards for surface water in China, the mean values of most of the water quality parameters in 27 rivers were lower than the values of grade III of the national standard (Table 1). In terms of nutrients, the averages of IMn, COD, and BOD5 were 4.49, 18.1, and 3.68 mg/L, respectively, which were slightly lower than the corresponding values of grade III (Table 1). However, the mean concentration of NH4+ (1.11 mg/L), TN (2.94 mg/L), and TP (0.22 mg/L) in river water were approximately 1.10, 2.94, and 1.10 times higher than the threshold values of grade III water quality (Table 1).
The average concentrations of all heavy metals satisfied the grade III of the surface water quality standard of China (Table 1). For highly toxic heavy metals, the mean contents of Hg, Pb, As, Cd, and Cr were 0.04, 2.39, 2.72, 0.50, and 4.06 μg/L, respectively, which were about 2.5–21 times lower than the threshold values of grade III water quality (Table 1). However, it should be noted that the maximum value of Fe (492 μg/L) and Mn (430 μg/L) greatly exceeded the limit values for centralized drinking water sources in China (Table 1).
3.2. Spatial Variations in River Water Quality
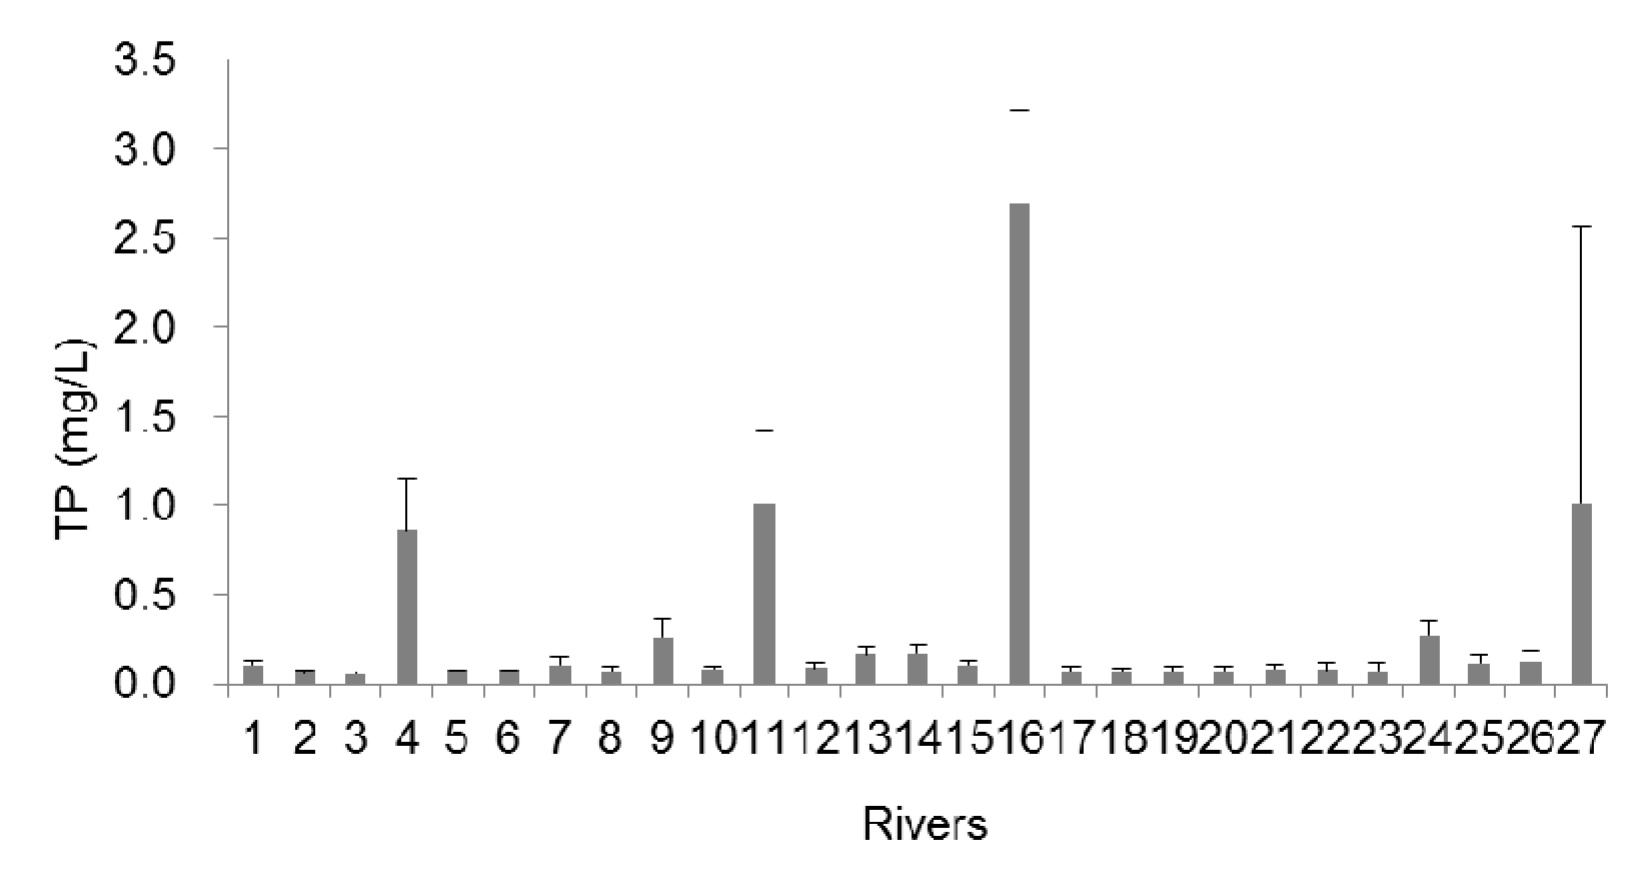
The spatial patterns of the water nutrients are shown in Figure 2. The highest values of IMn (25.1 mg/L), COD (112 mg/L), and BOD5 (30.1 mg/L) were all found in site 11 (Lianjiang River). The spatial patterns of N-related parameters in river water were relatively complex (Figure 2). The highest concentrations of water NH4+ (8.84 mg/L) and NO3− (2.66 mg/L) were detected in site 11 (Lianjiang River) and site 24 (Dongjiang River south tributary), respectively, while the maximum TN concentration (11.9 mg/L) occurred in site 4 (Shenzhen River).
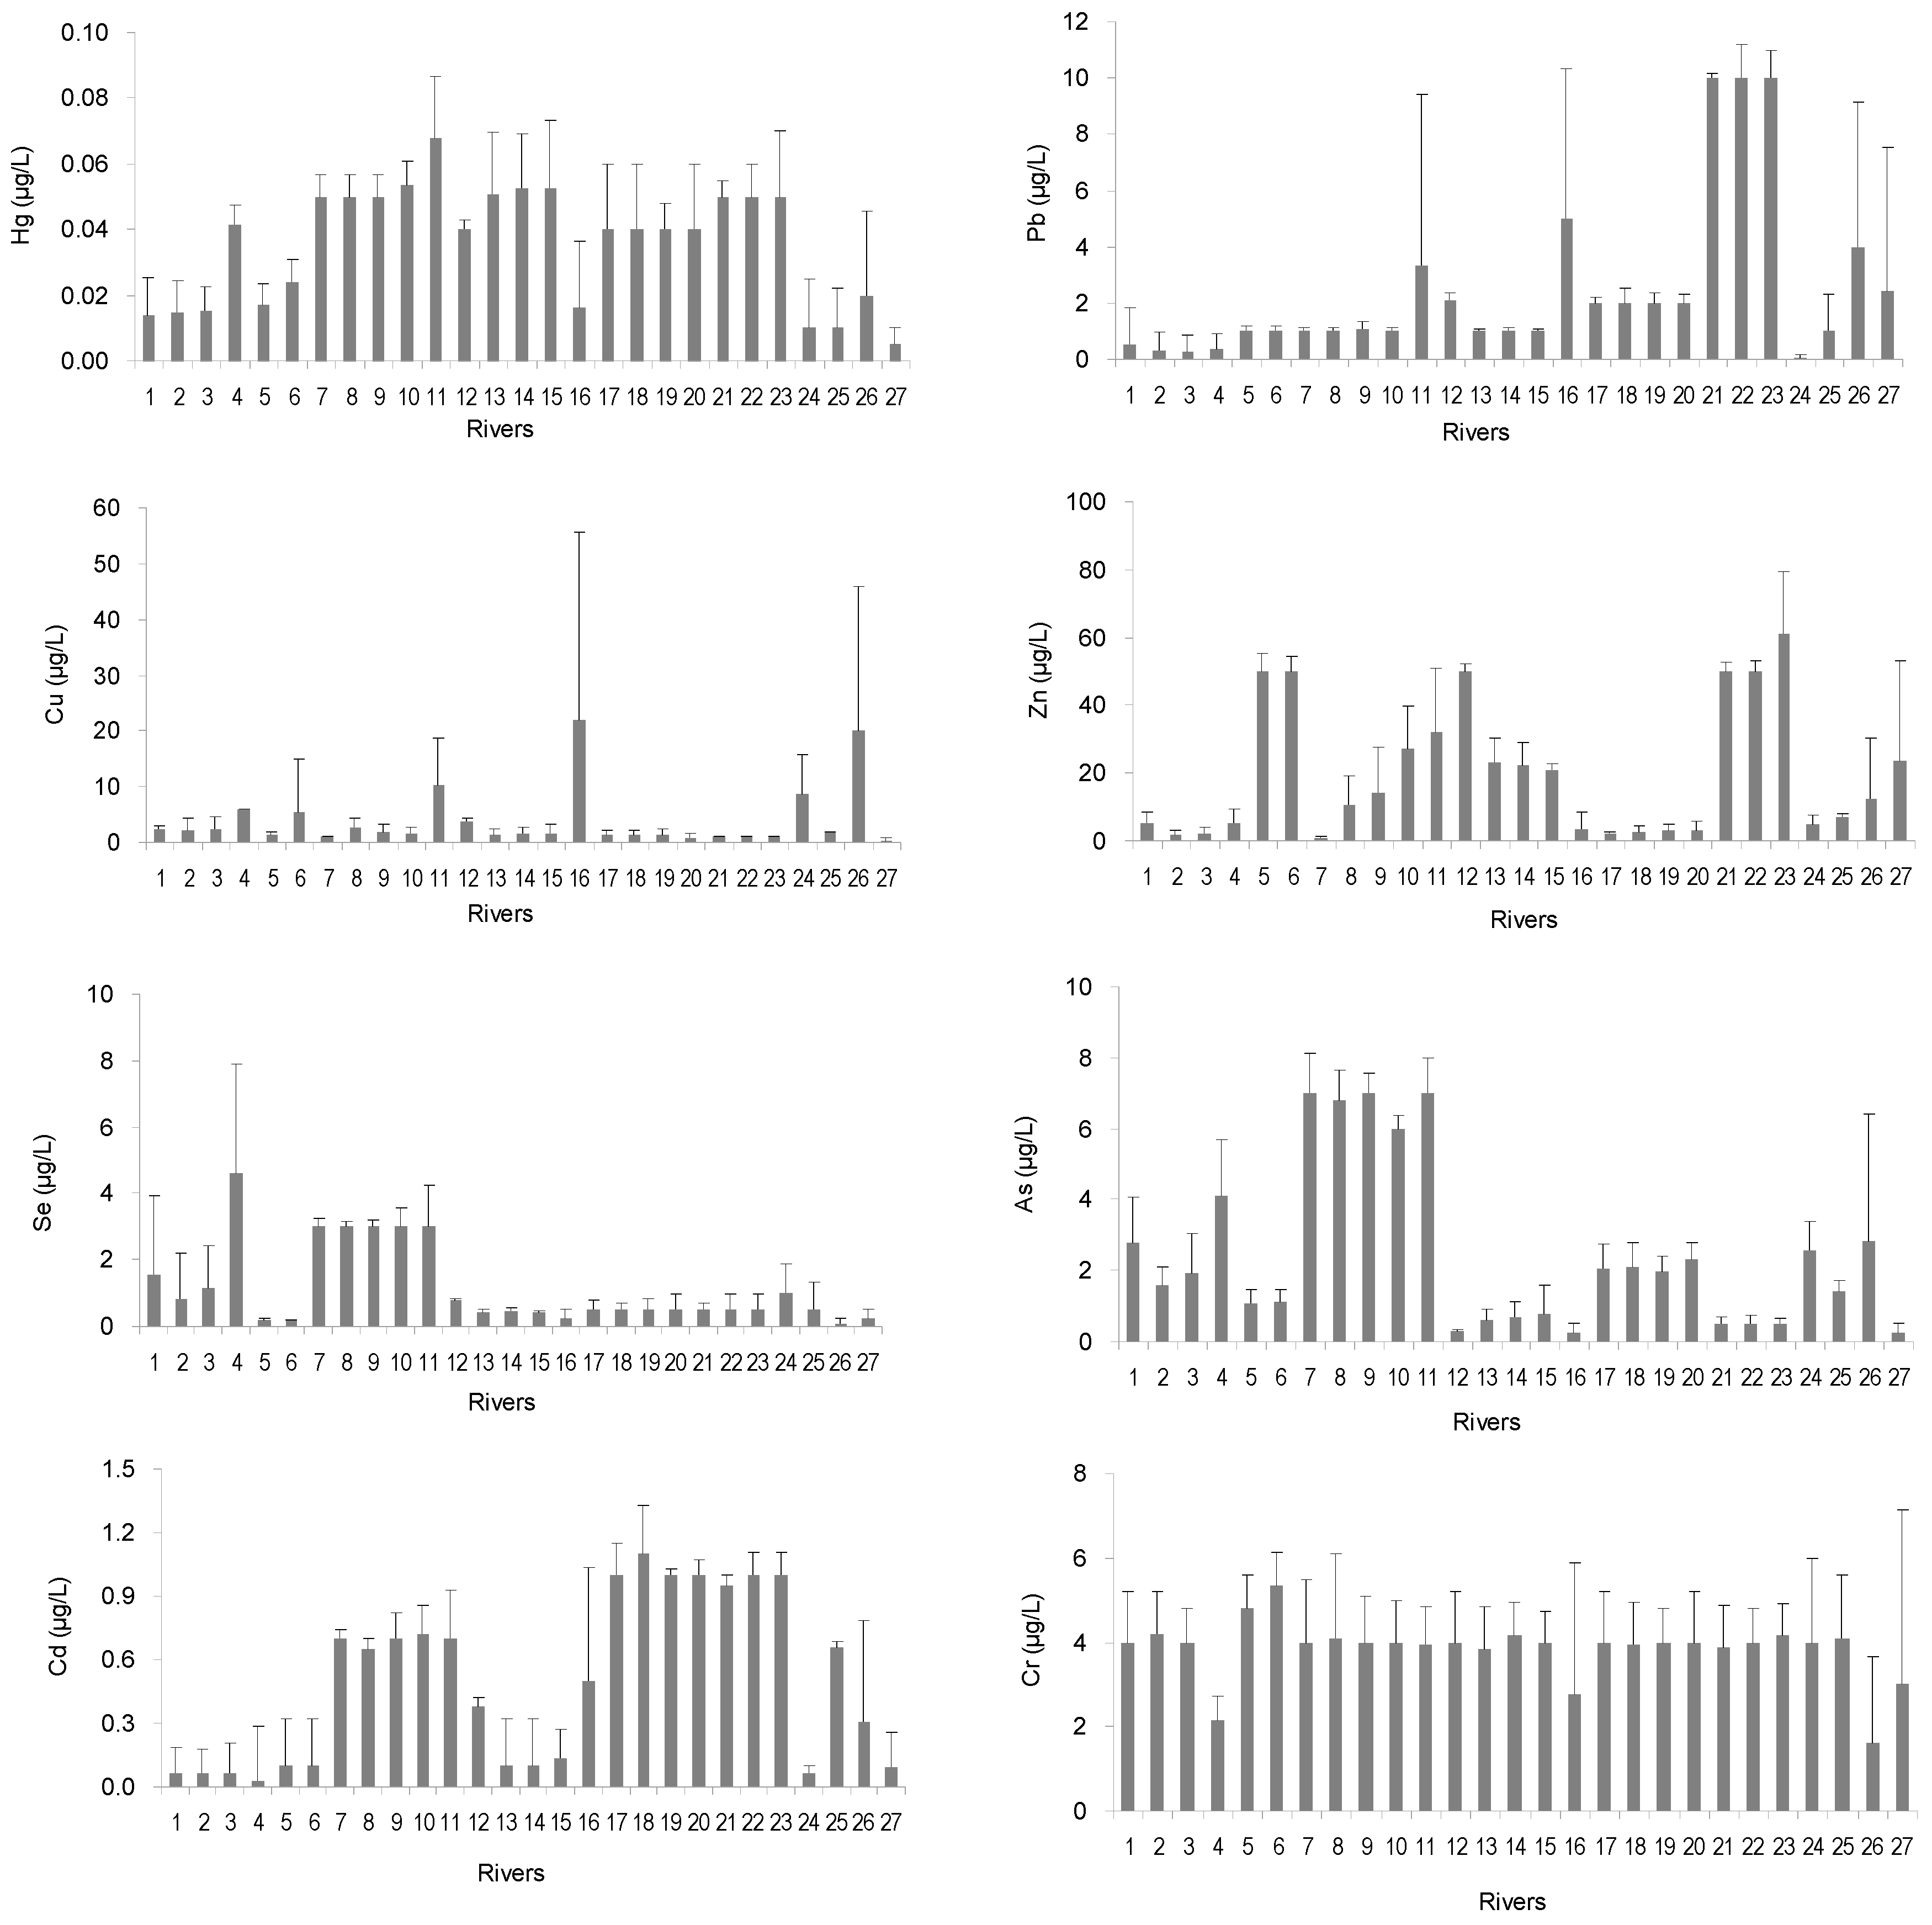
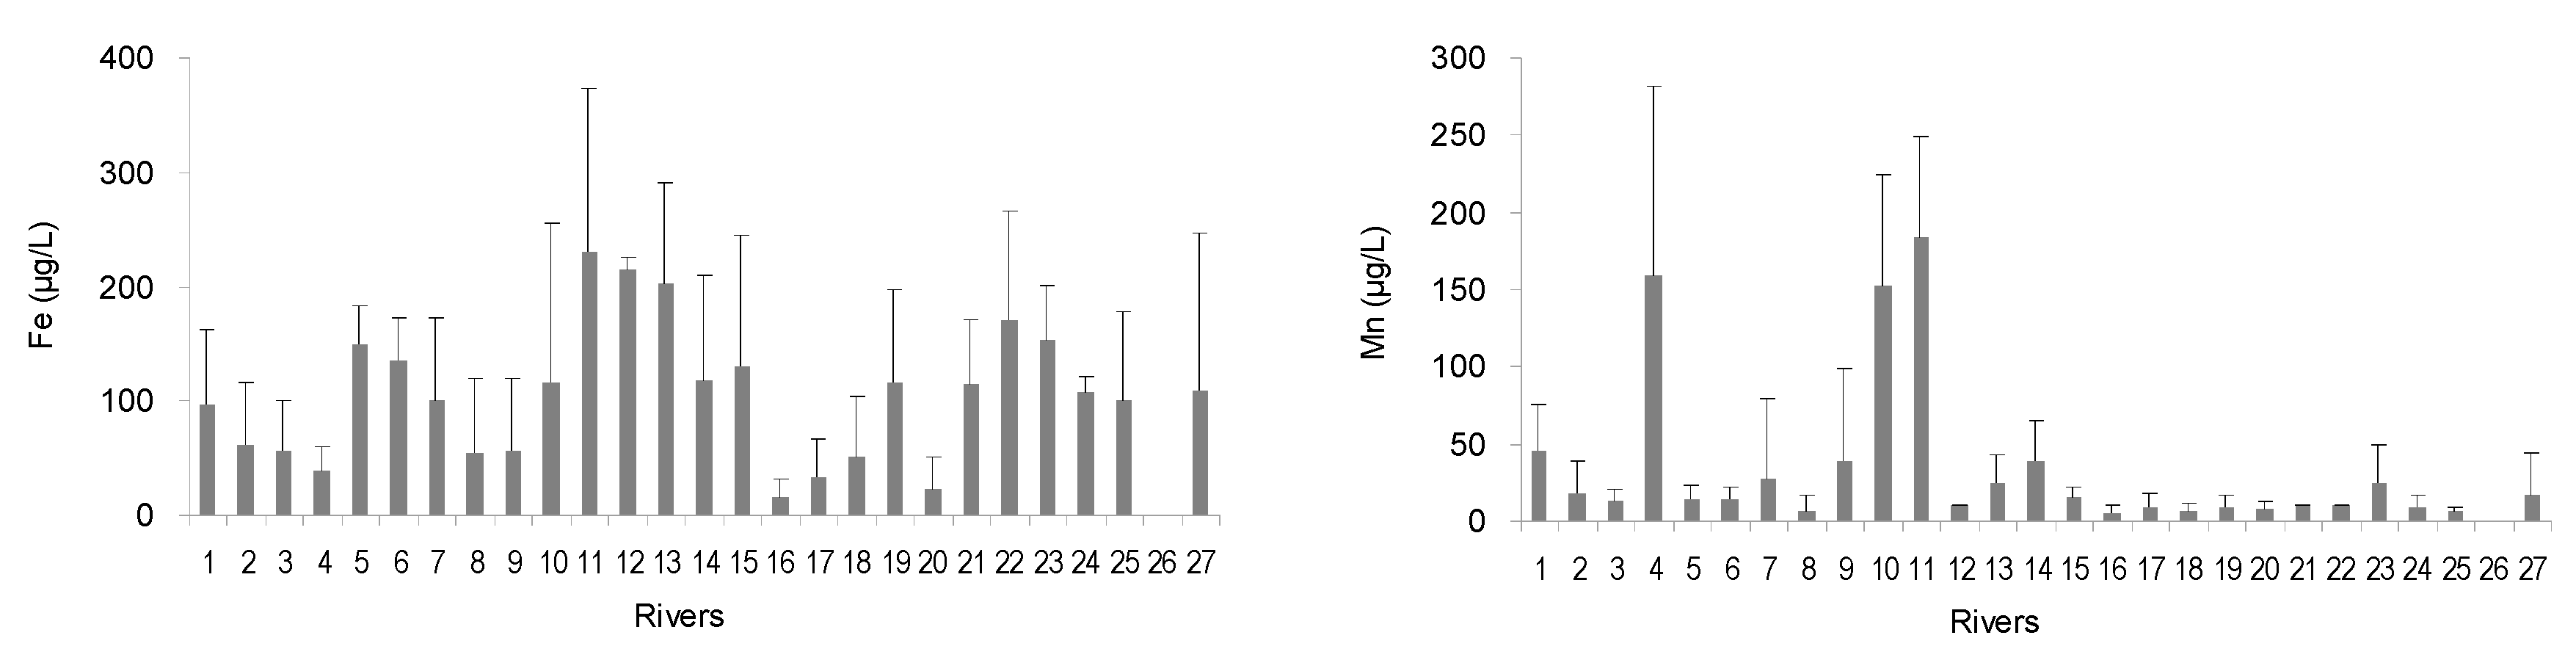
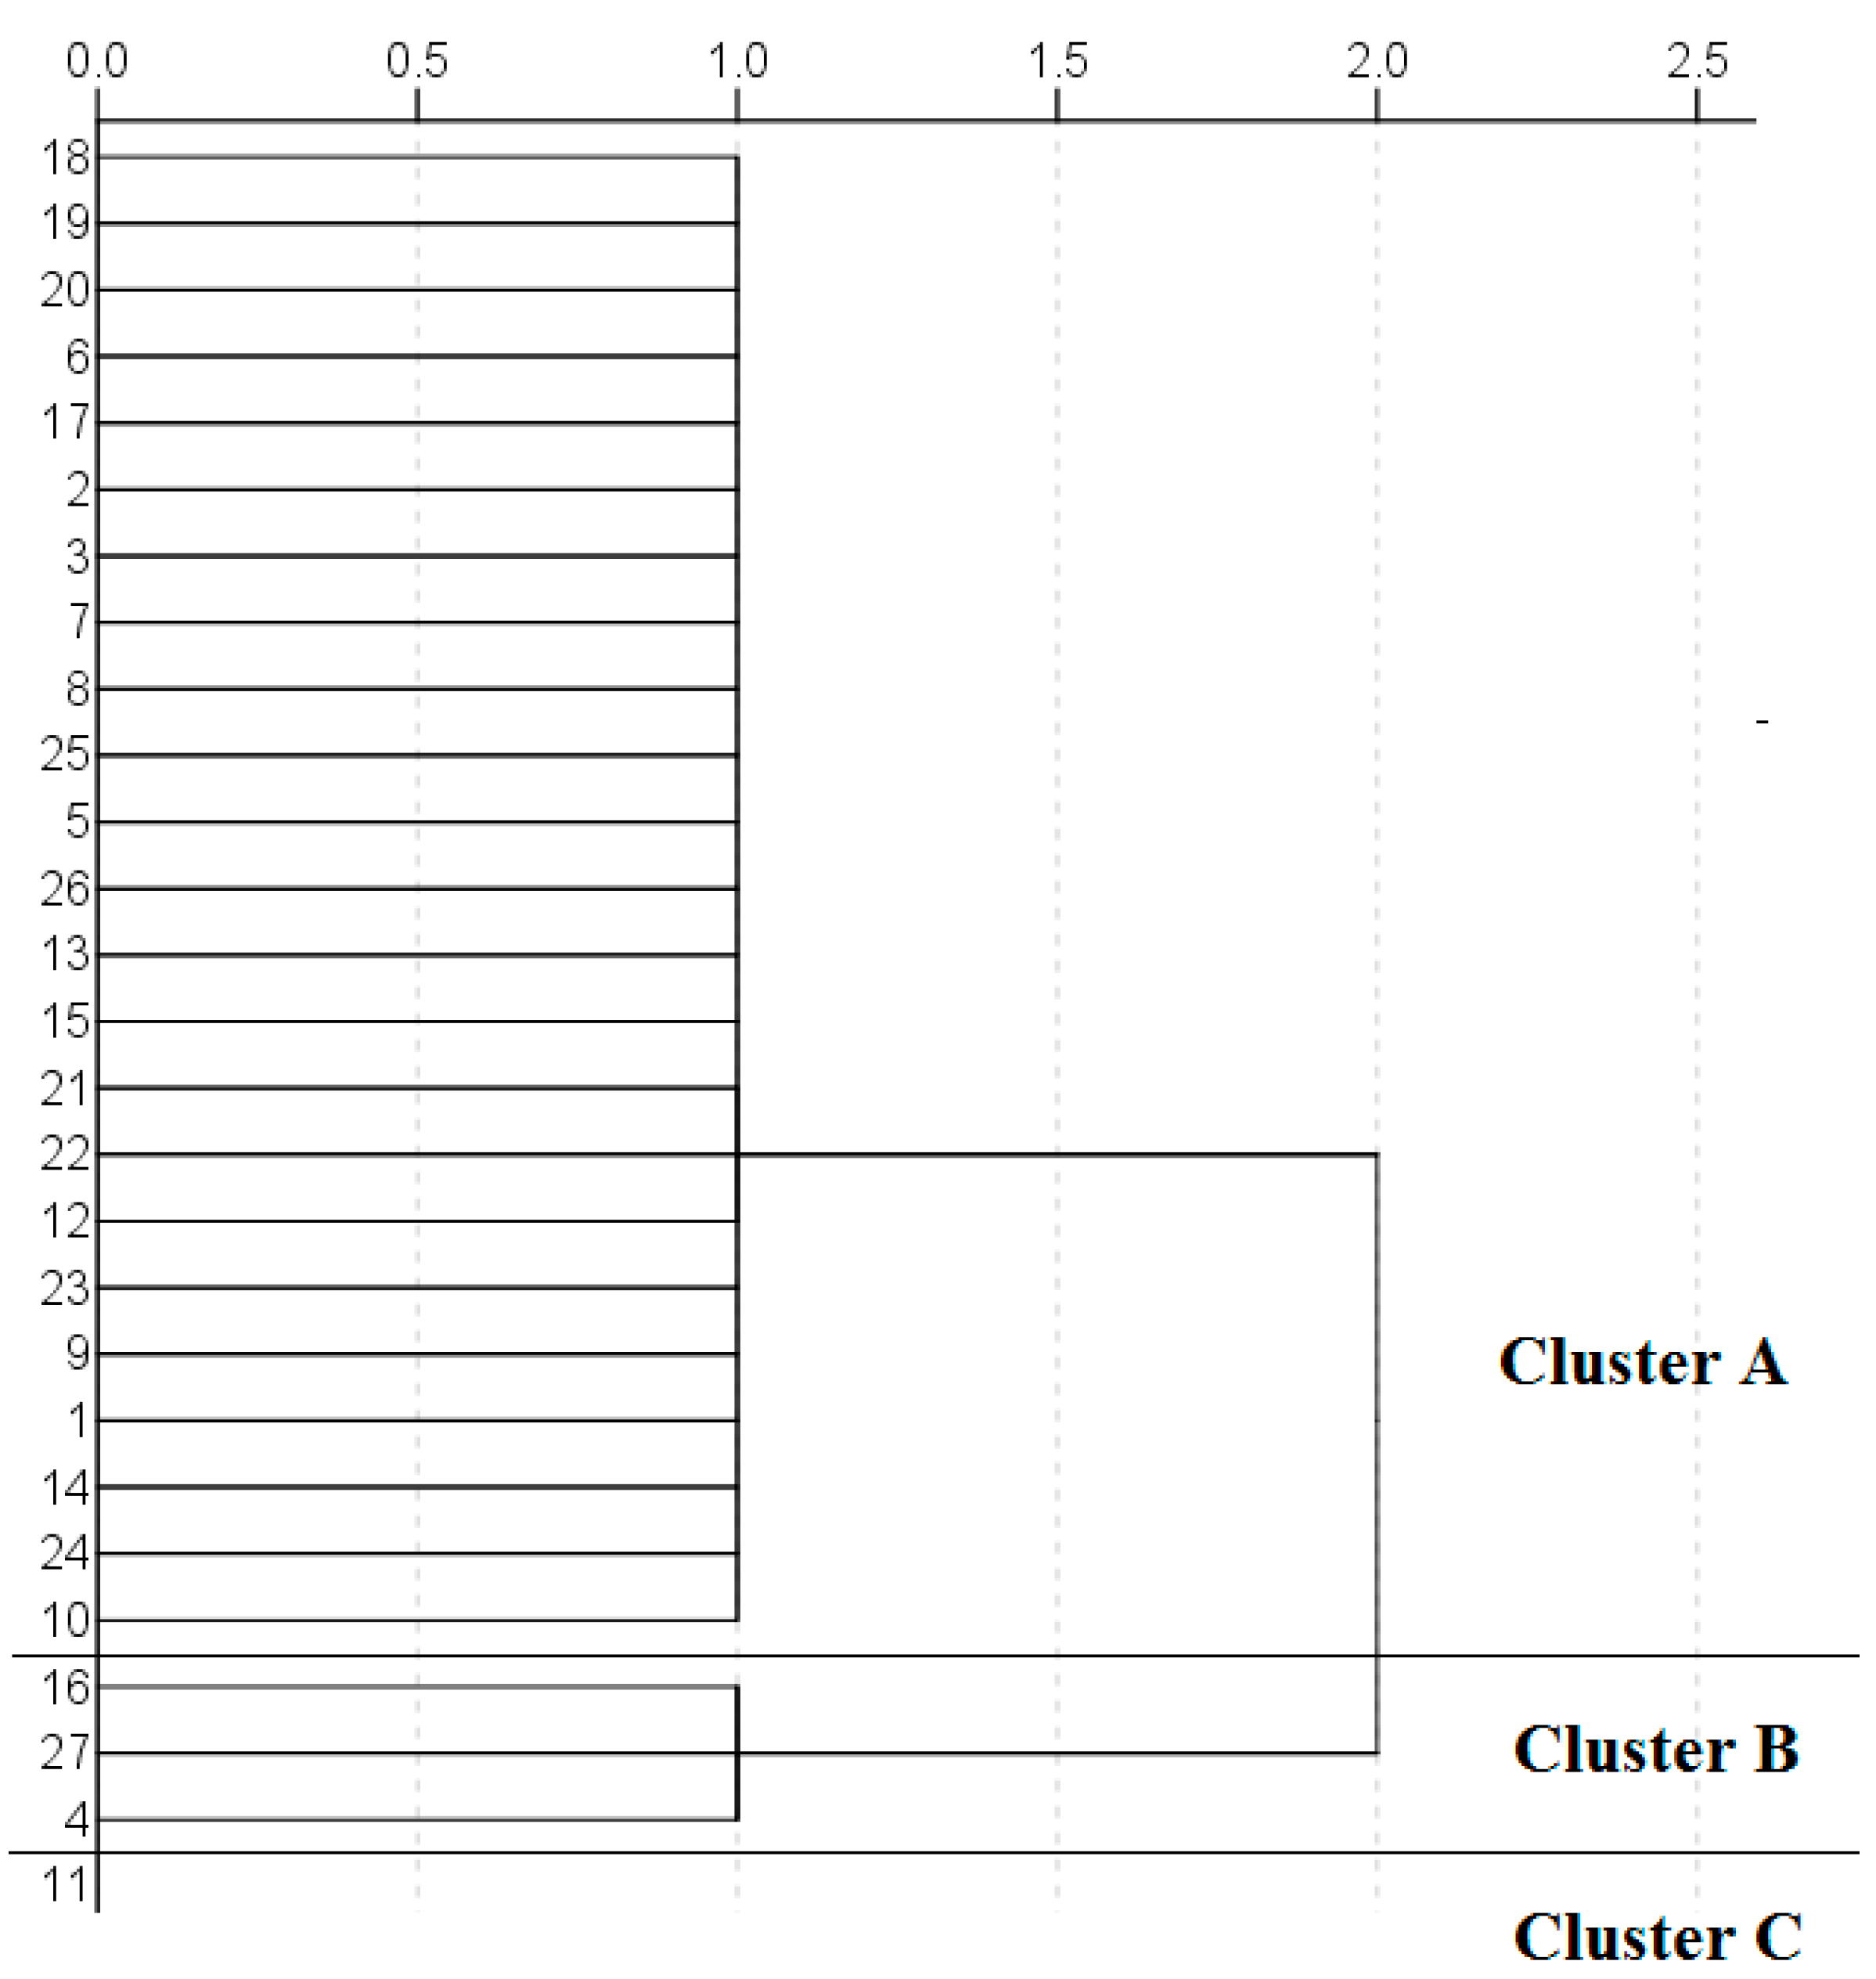
For heavy metals, the highest concentrations of Hg (0.07 μg/L), Fe (232 μg/L), and Mn (184 μg/L) were all found in site 11 (Lianjiang River; Figure 3). In addition, the largest values of Cu (22.0 μg/L), Zn (61.0 μg/L), and Cr (5.33 μg/L) were found in site 16 (Danaohe River), site 23 (Moyangjiang River) and site 6 (Pearl River Modaomen waterway), respectively. Hierarchical cluster analysis classified the 27 river sites into three spatial clusters (Figure 4), corresponding to the low, moderate, and high pollution levels, respectively. All water nutrient parameters (except NO3− concentration) in cluster B were significantly higher than those in cluster A (Table 2).
3.3. Seasonal Variations in River Water Quality
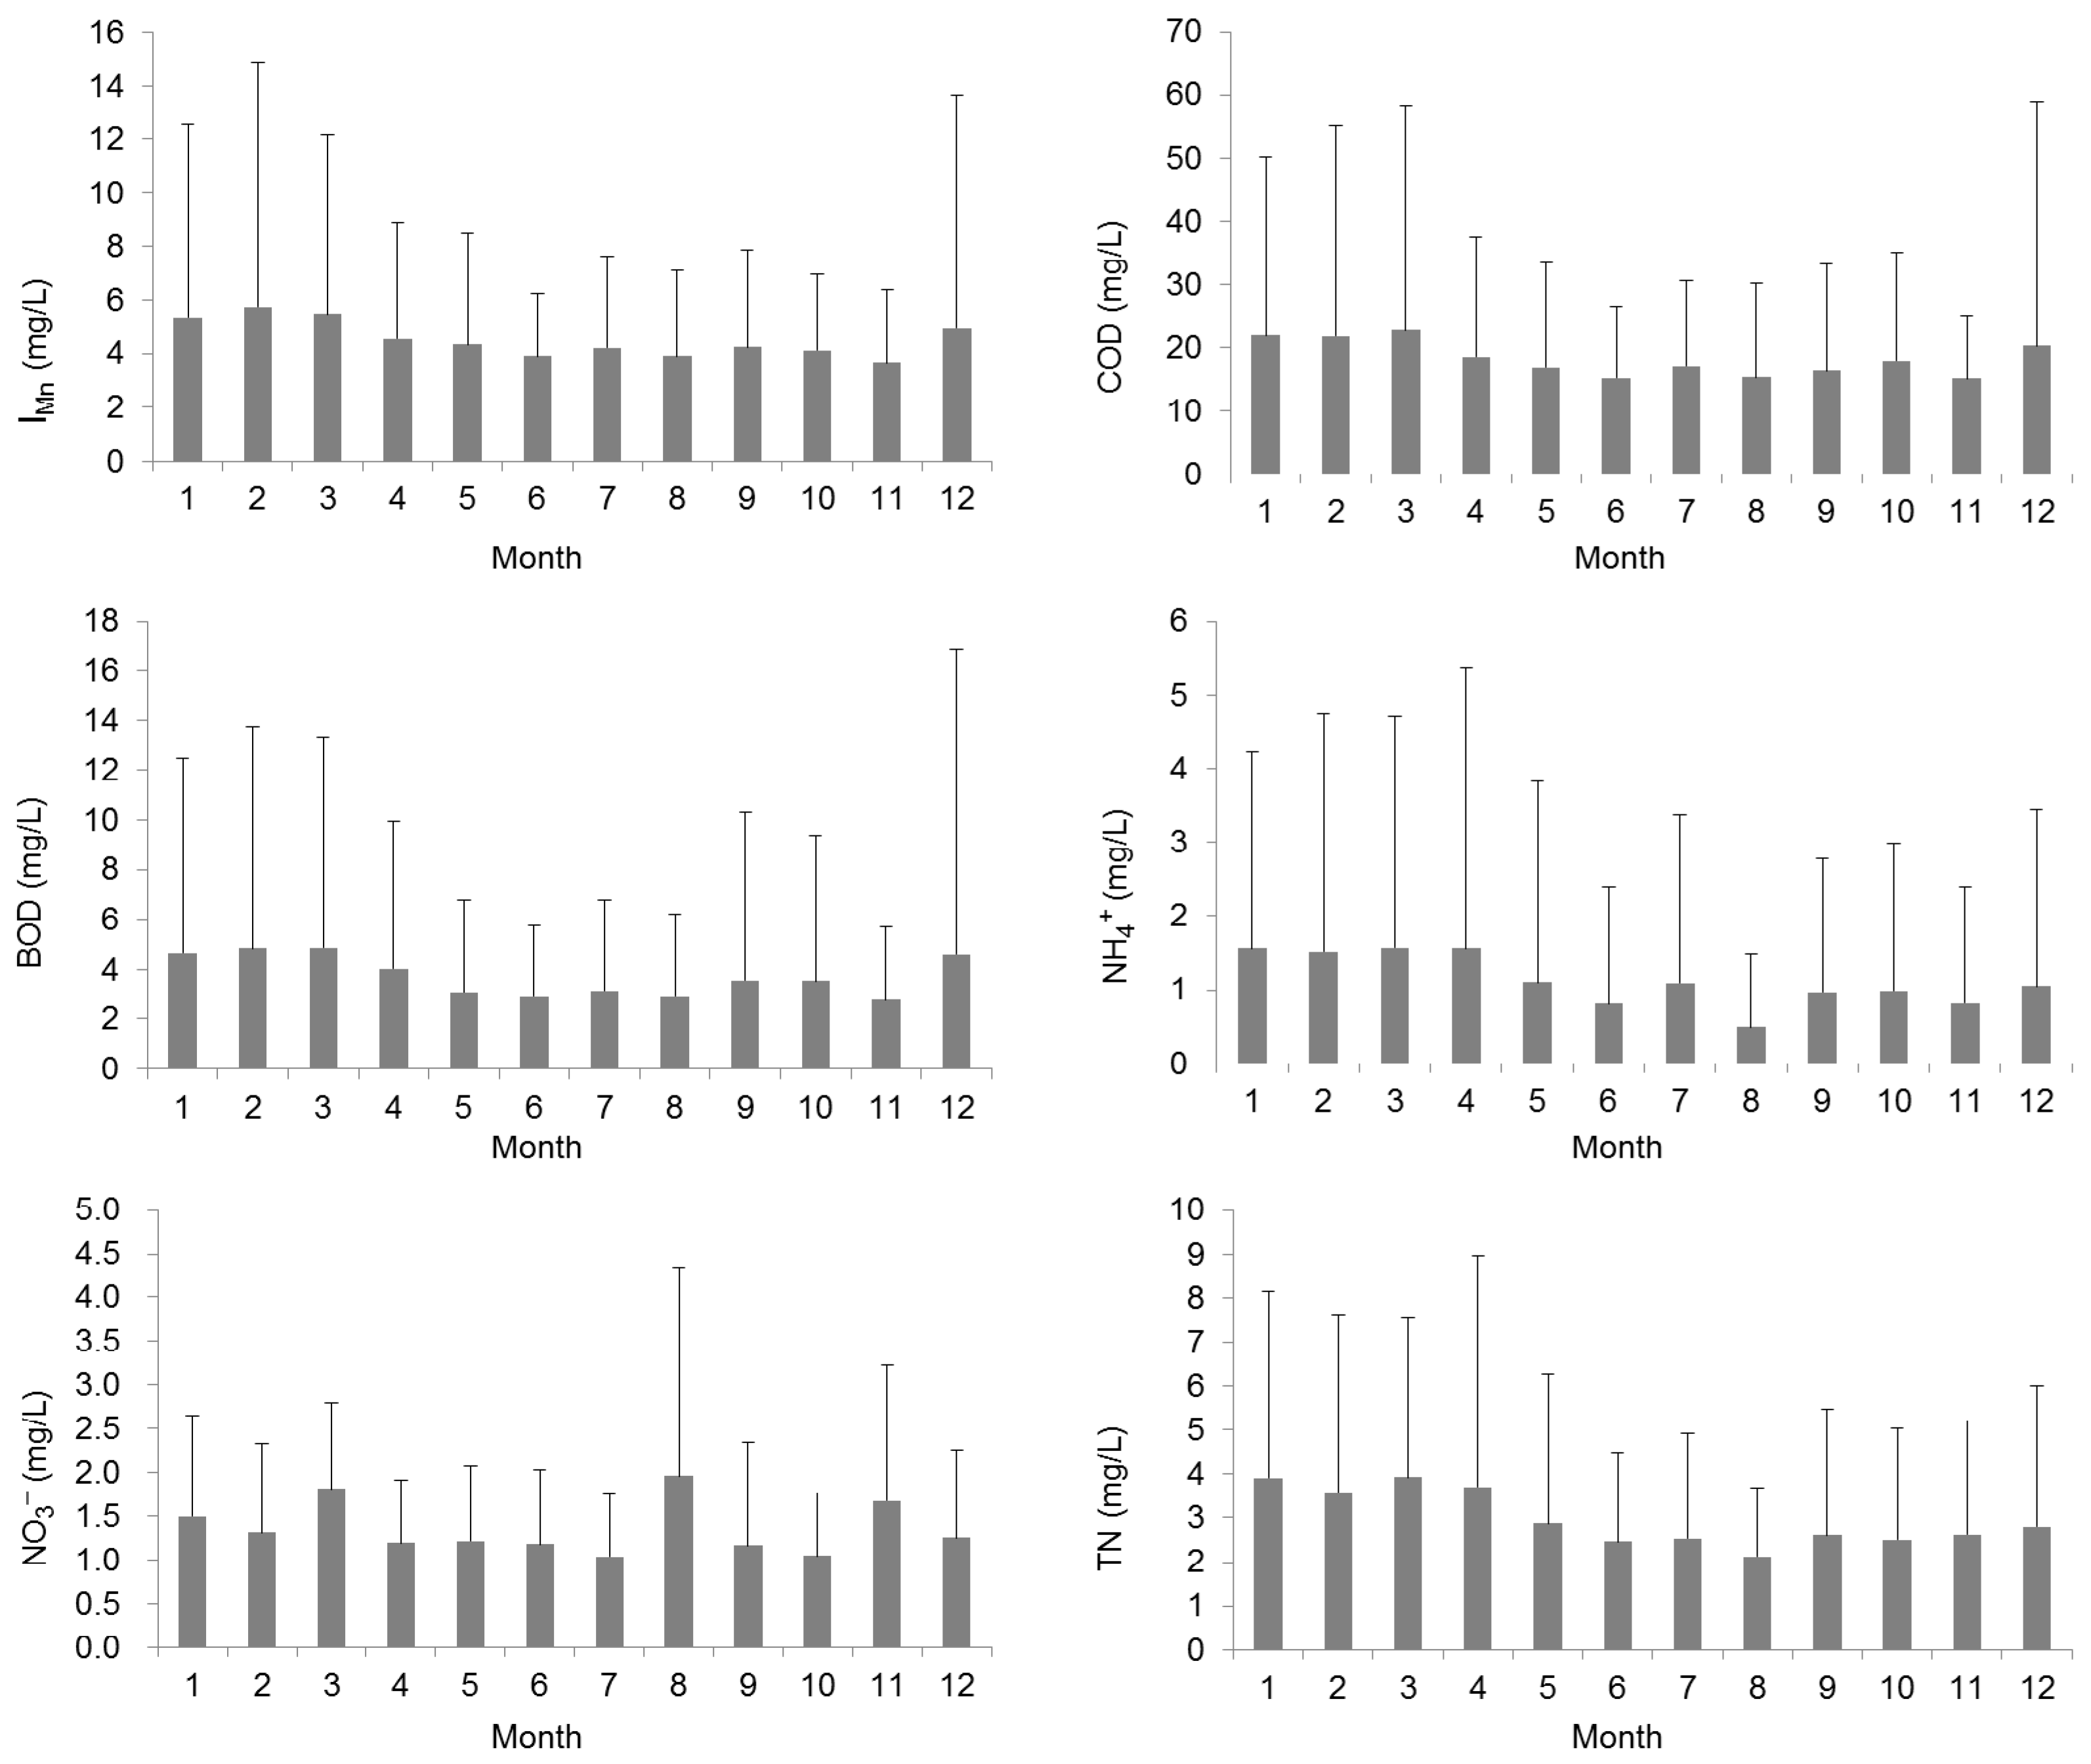
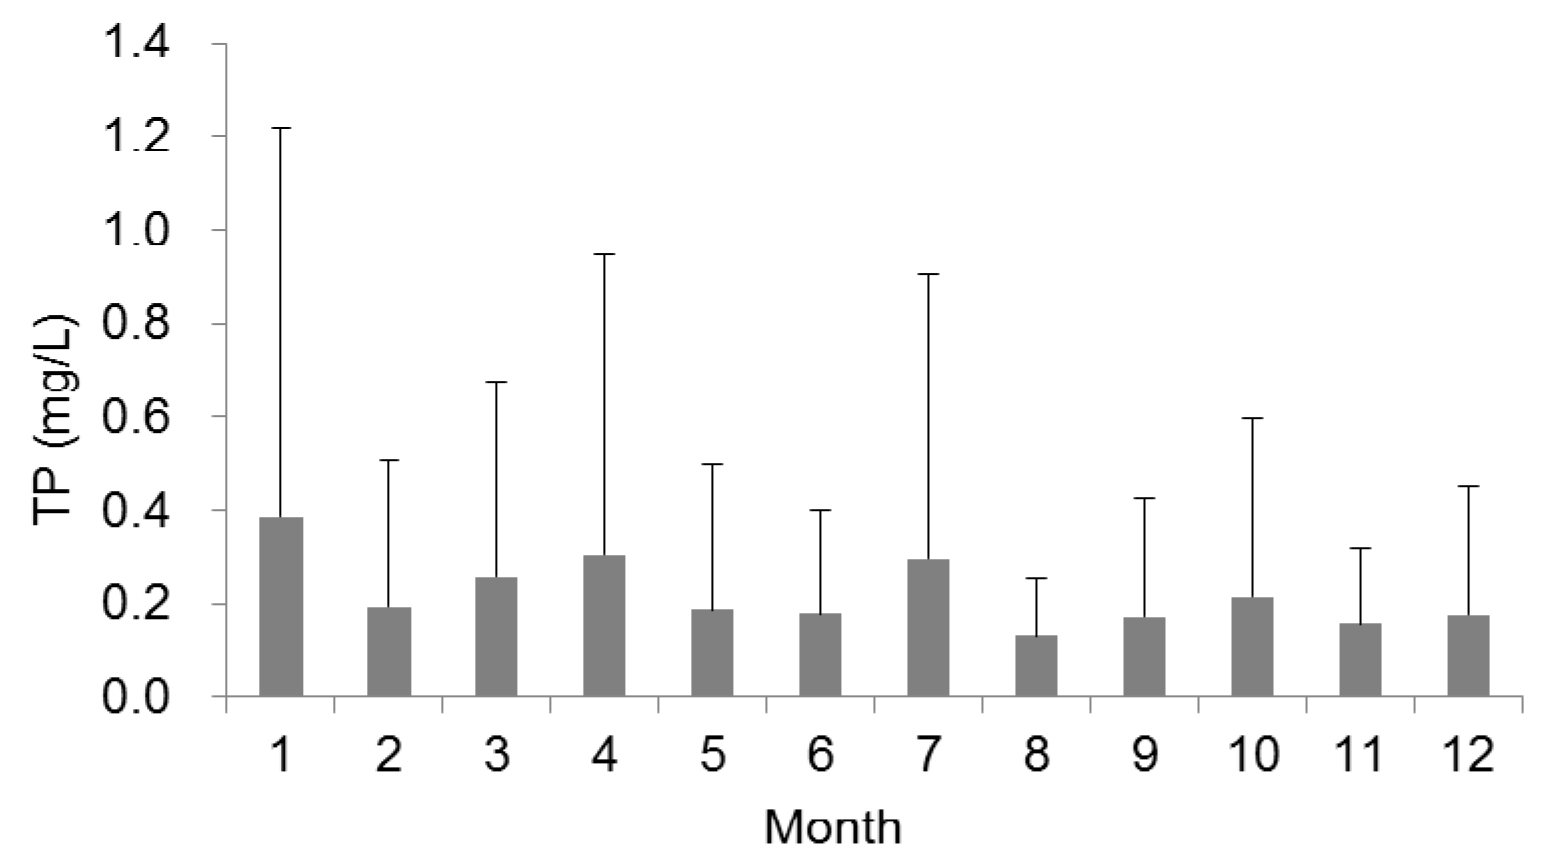
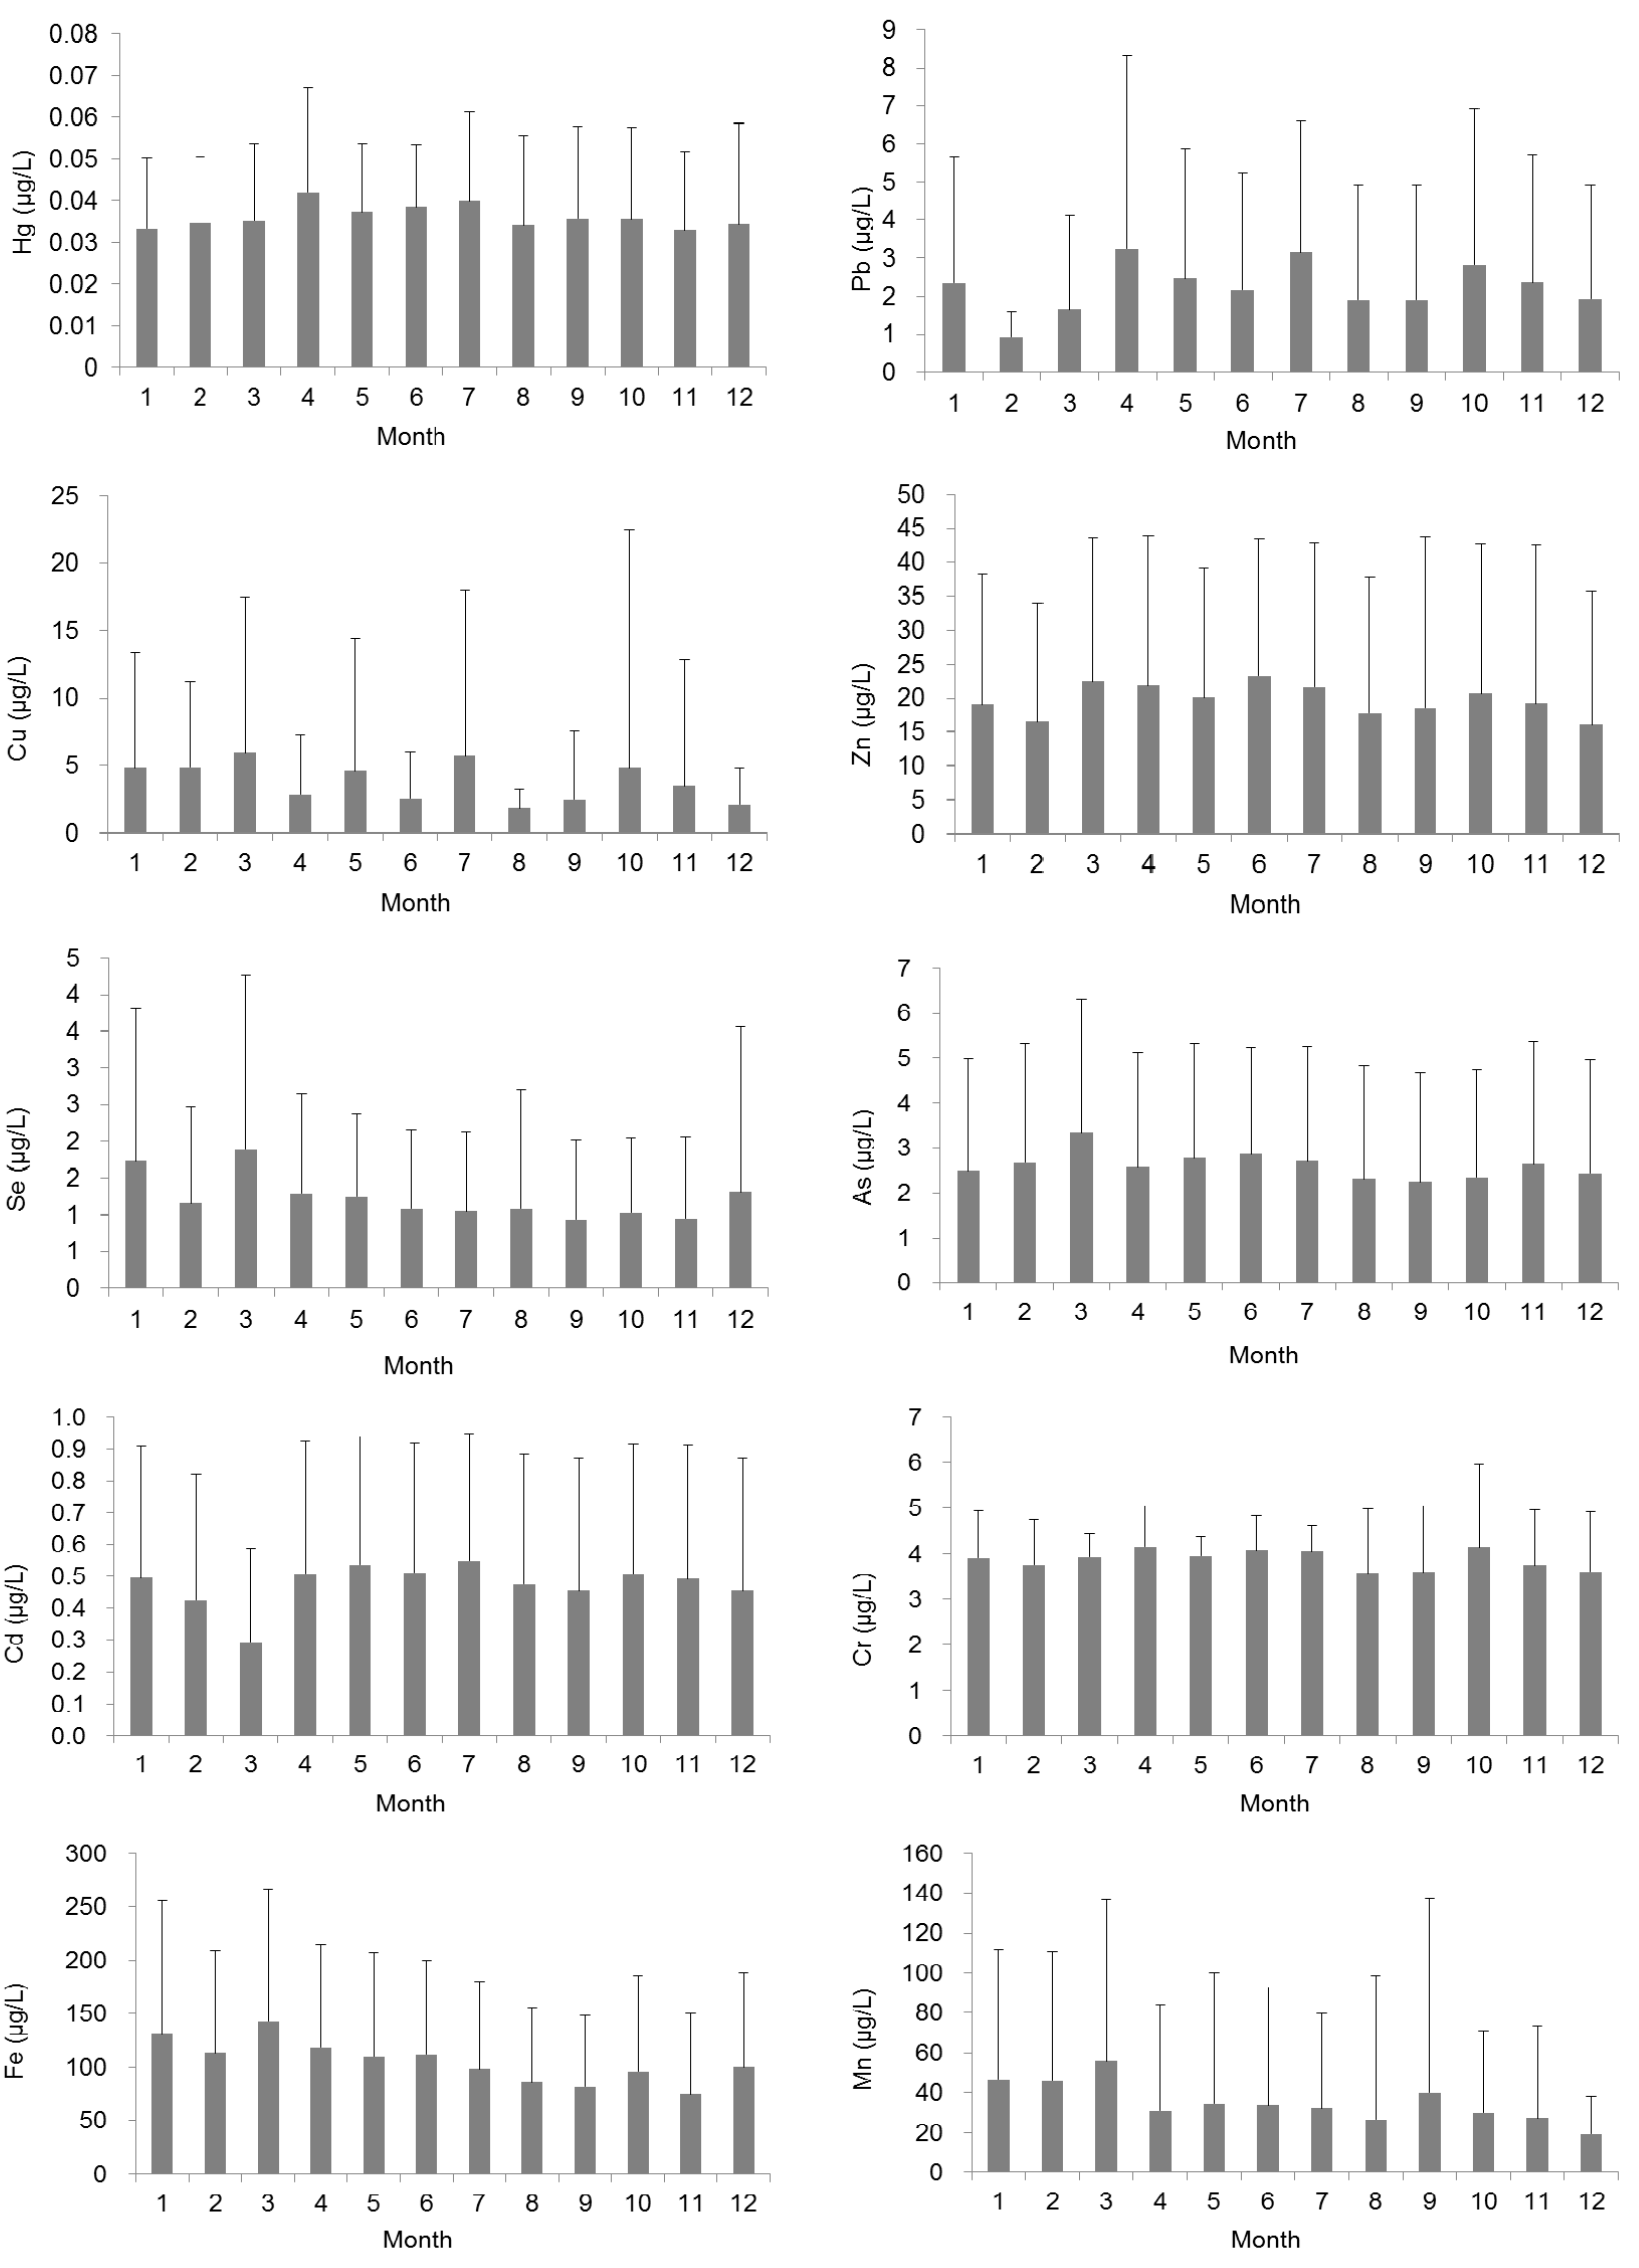
In general, the mean concentrations of most of the nutrient variables were relatively high in the first 3–4 months of the year, and then experienced a gradual decrease in the following months (Figure 5). However, the temporal patterns of NO3− and TP concentrations were relatively irregular and complex, with the largest values found in August and January, respectively. For the heavy metals, the contents of all heavy metals (except Pb, Cu, and Mn) were relatively stable over the one-year period (Figure 6). The COD and BOD5 values in the wet season (from April to September) were significantly lower than those in the dry season (from October to the next March; Table 2). For heavy metals, only the Hg concentration had a significant difference between the wet and dry seasons (Table 2).
3.4. Identification of Possible Pollution Sources
The PCA indicated that four principal components (PC) explained 80.87% of the total variance (Table 3). The PC1 accounted for 36.35% of the total variance and had strong positive loadings on IMn, COD, BOD5, NH4+, TN, and Mn. The Pearson correlation analysis showed a positive relationship between nutrient variables (Table 4). Therefore, multiple nutrients might be discharged from the same pollution sources. The PC2, explaining about 18.61% of the total variance, had strong positive loadings on two metals (Hg and Cd) and a negative loading on NO3− (Table 3). The two heavy metals might come mainly from industrial processes (e.g., manufacture of electronic devices) in this region. The PC3 (14.13% of the total variance) had strong positive loadings on Zn and Fe, representing the metal pollution from mining and smelting activities. The PC4 (11.77% of the total variance) were most dependent upon Pb, Cu, and TP, and these elements likely originated from rock weathering and soil erosion (Table 3).
4. Discussion
4.1. Spatial and Seasonal Pattern of Water Quality in Subtropical Rivers
Spatial pattern analysis indicated that the highest values of IMn, COD, BOD5, and NH4+ were all found in Lianjiang River (Figure 2). The Lianjiang River, originating in the Wufengshan Mountains, had a catchment area of approximately 1353 km2 and a length of 71.1 km [34]. The river received large amounts of domestic sewage, industrial effluent and agricultural runoff from Jieyang City and Shantou City, which were the main industrial cities of Guangdong province. The Lianjiang River Basin had a GDP of 132.16 billion Chinese Yuan and a population of more than 4.3 million inhabitants in 2013. It was estimated that approximately 8.597 × 10⁵ tons of domestic sewage and 2.025 × 10⁵ tons of industrial wastewaters were produced per day in the Lianjiang River basin [34]. Unfortunately, nearly 83.2% of the domestic wastewaters in urban and rural settlements were not treated before discharge into the surrounding environments. The industrial wastewaters from 289 heavy polluting enterprises (most were textile and dyeing enterprises) were not fully treated because the illegal discharge of wastewaters was common in small enterprises. In addition, there were more than 70 large livestock and poultry farms in this basin, which produced large amounts of animal wastes and contributed significantly to the nutrient pollution of river water.
Our study found that the values of COD and BOD5 in the dry season (from October to the next March) were significantly higher than those in the wet season (from April to September) in rivers draining into the South China Sea (Table 2). Many previous studies reported a similar observation in other subtropical regions. For instance, Li et al. (2009) demonstrated that dissolved N and P levels in river waters were relatively higher in the dry season than in the wet season in the upper Han River basin, China [11]. Moreover, Wang et al. (2010) indicated that the wet season had higher concentrations of nutrients and heavy metals than the dry season in water bodies in the Grand Canal of China [35]. These findings are probably partly due to high river flows and the resultant dilution effect in the wet season [2]. Another possible reason is that aquatic macrophytes growing in riparian wetlands and shallow water bodies can absorb and accumulate large quantities of contaminants in the wet season [35]. However, several studies did not match our above findings [36,37]. Hong et al. (2008) showed that the water TN and TP concentrations in the Xingfengjiang Reservoir basin in the dry season were not significantly different from those in the wet season [37]. The inconsistent results may be mainly attributed to the difference among catchments in terms of the land use composition and agricultural types, which strongly affect the outputs of nutrients and heavy metals. It has been reported that surface runoff in agricultural watersheds can contribute significant amounts of non-point source pollution to the receiving water bodies in the wet season [35].
4.2. Possible Source Identification of Pollutants in Subtropical Rivers
Pollutants including nutrients and heavy metals in river waters might originate from a number of natural and anthropogenic sources in terrestrial habitats [3,9]. The present study found that nutrients in rivers draining into the South China Sea might mainly come from domestic, industrial, and agricultural wastewaters. Many studies indicated that high N and P concentrations in aquatic ecosystems were generally related to high population density and intensive agricultural activities in catchments [38,39,40,41,42]. The percentage of cropland in Guangdong Province was approximately 18%, and most of the croplands were planted with rice, sugarcane, and vegetables [43]. With intensive agricultural development, excessive utilization of chemical fertilizers for enhancing crop productivity became a major environmental problem and resulted in water quality degradation and eutrophication in many rivers in Guangdong Province [27]. Fortunately, the non-point source pollution has attracted growing attention in recent years. A number of wastewater treatment technologies such as constructed wetlands, sand filters, and detention ponds have been widely used to remove pollutants from wastewaters in Guangdong Province [44].
Our study indicated that the sources of heavy metals in rivers draining into the South China Sea were varied. Although the mean concentrations of all measured heavy metals were relatively low, the maximum value of Fe and Mn exceeded the limit values for centralized drinking water sources in China (Table 1). We found that Fe and Zn might possibly come from mining and smelting activities. In general, mining and smelting were the main anthropogenic sources of Fe and Zn contamination in river water [20]. There were numerous mining and smelting factories in Guangdong Province, especially in the northern part of the province where many rivers and streams (e.g., the Pearl River) originated [20]. Two highly toxic metals (Hg and Cd) might mainly come from various industrial sources including electronic factories, industrial boilers, power plants and cement plants [45]. Although Zinc smelting was recognized as one of the most important sources of Hg emission [45], it may not be the main source of Hg in Guangdong Province because our data showed a non-significant relationship between Hg and Zn concentrations in river waters.
5. Conclusions
This study investigated the water nutrient and heavy metal pollution in 27 subtropical rivers draining into the South China Sea and found that the averages of most water quality parameters were lower than the corresponding values of the grade III water quality standard of China. Spatial pattern and cluster analyses revealed that the Lianjiang River was the most polluted, with the highest levels of IMn, COD, BOD5, NH4+, Hg, Fe, and Mn. The river water quality showed a significant difference in seasonal variations of COD, BOD5 and Hg during the dry and wet seasons. PCA demonstrated that nutrients might originate from domestic, industrial and agricultural wastewaters, while heavy metals likely came from industrial activities and natural processes. Although the local governments have paid great attention to the water quality improvement in rivers draining to the South China Sea, our findings suggest that more efforts should be made to control the nutrients exported from catchments in the future. In addition, further studies using isotope techniques are needed to more precisely determine the sources of nutrients and heavy metals in these rivers.
Acknowledgments
This work was supported by the Foundation of College of Forestry and Landscape Architecture, South China Agricultural University (Grant No. 2016LA024).
Author Contributions
Amei Deng and Wenzhi Liu designed the study; Changdong Ye collected the data; Amei Deng and Changdong Ye analyzed the data; Amei Deng and Wen Liu wrote the article.
Conflicts of Interest
The authors declare no conflict of interest.
References
- Jarvie, H.P.; Whitton, B.A.; Neal, C. Nitrogen and phosphorus in east coast British rivers: Speciation, sources and biological significance. Sci. Total Environ. 1998, 210, 79–109. [Google Scholar] [CrossRef]
- Liu, W.; Zhang, Q.; Liu, G. Effects of watershed land use and lake morphometry on trophic state of Chinese lakes: Implications for eutrophication control. Clean Soil Air Water 2011, 39, 35–42. [Google Scholar] [CrossRef]
- Li, S.; Zhang, Q. Spatial characterization of dissolved trace elements and heavy metals in the upper river (China) using multivariate statistical techniques. J. Hazard. Mater. 2010, 176, 579–588. [Google Scholar] [CrossRef] [PubMed]
- Bu, H.; Meng, W.; Zhang, Y. Nitrogen pollution and source identification in the Haicheng River basin in Northeast China. Sci. Total Environ. 2011, 409, 3394–3402. [Google Scholar] [CrossRef] [PubMed]
- Varol, M.; Şen, B. Assessment of nutrient and heavy metal contamination in surface water and sediments of the upper Tigris River, Turkey. Catena 2012, 92, 1–10. [Google Scholar] [CrossRef]
- Gong, Y.; Yu, Z.; Yao, Q.; Chen, H.; Mi, T.; Tan, J. Seasonal variation and sources of dissolved nutrients in the Yellow River, China. Int. J. Environ. Res. Public Health 2015, 12, 9603–9622. [Google Scholar] [CrossRef] [PubMed]
- Smith, V.H.; Tilman, G.D.; Nekola, J.C. Eutrophication: Impacts of excess nutrient inputs on freshwater, marine, and terrestrial ecosystems. Environ. Pollut. 1999, 100, 179–196. [Google Scholar] [CrossRef]
- Oczkowski, A.; Nixon, S. Increasing nutrient concentrations and the rise and fall of a coastal fishery; a review of data from the Nile Delta, Egypt. Estuar. Coast. Shelf Sci. 2008, 77, 309–319. [Google Scholar] [CrossRef]
- Mendiguchía, C.; Moreno, C.; García-Vargas, M. Evaluation of natural and anthropogenic influences on the Guadalquivir River (Spain) by dissolved heavy metals and nutrients. Chemosphere 2007, 69, 1509–1517. [Google Scholar] [CrossRef] [PubMed]
- Bhattachatya, B.D.; Nayak, D.C.; Sarkar, S.K.; Biswas, S.N.; Rakshit, D.; Ahmed, M.K. Distribution of dissolved trace metals in coastal regions of Indian Sundarban mangrove wetland: A multivariate approach. J. Clean. Prod. 2015, 96, 233–243. [Google Scholar] [CrossRef]
- Li, S.; Liu, W.; Gu, S.; Cheng, X.; Xu, Z.; Zhang, Q. Spatio-temporal dynamics of nutrients in the upper Han River basin, China. J. Hazard. Mater. 2009, 162, 1340–1346. [Google Scholar] [CrossRef] [PubMed]
- Nriagu, J.O. A global assessment of natural sources of atmospheric trace metals. Nature 1989, 338, 47–49. [Google Scholar] [CrossRef]
- Krishna, A.K.; Satyanarayanan, M.; Govil, P.K. Assessment of heavy metal pollution in water using multivariate statistical techniques in an industrial area: A case study from Patancheru, Medak District, Andhra Pradesh, India. J. Hazard. Mater. 2009, 167, 366–373. [Google Scholar] [CrossRef] [PubMed]
- Sekabira, K.; Oryem-Origa, H.; Basamba, T.A.; Mutumba, G.; Kakudidi, E. Assessment of heavy metal pollution in the urban stream sediments and its tributaries. Int. J. Environ. Sci. Technol. 2010, 7, 435–446. [Google Scholar] [CrossRef]
- Billen, G.; Garnier, J. River basin nutrient delivery to the coastal sea: Assessing its potential to sustain new production of non-siliceous algae. Mar. Chem. 2007, 106, 148–160. [Google Scholar] [CrossRef]
- Howarth, R.W.; Sharpley, A.; Walker, D. Sources of nutrient pollution to coastal waters in the United States: Implications for achieving coastal water quality goals. Estuaries 2002, 25, 656–676. [Google Scholar] [CrossRef]
- Gao, X.; Song, J. Phytoplankton distributions and their relationship with the environment in the Changjiang Estuary, China. Mar. Pollut. Bull. 2005, 50, 327–335. [Google Scholar] [CrossRef] [PubMed]
- Qu, H.J.; Kroeze, C. Past and future trends in nutrients export by rivers to the coastal waters of China. Sci. Total Environ. 2010, 408, 2075–2086. [Google Scholar] [CrossRef] [PubMed]
- Strokal, M.; Yang, H.; Zhang, Y.C.; Kroeze, C.; Li, L.L.; Luan, S.J.; Wang, H.Z.; Yang, S.S.; Zhang, Y.S. Increasing eutrophication in the coastal seas of China from 1970 to 2050. Mar. Pollut. Bull. 2014, 85, 123–140. [Google Scholar] [CrossRef] [PubMed]
- Wang, L.; Björn, L.O. Heavy metal pollution in Guangdong Province, China, and the strategies to manage the situation. Front. Environ. Sci. 2014, 2, 1–12. [Google Scholar] [CrossRef]
- Wunderlin, D.A.; Díaz, M.P.; Ame, M.V.; Pesce, S.F.; Hued, A.C.; Bistoni, M.A. Pattern recognition techniques for the evaluation of spatial and temporal variations in water quality. A case study: Suquía river basin (Córdoba, Argentina). Water Res. 2001, 35, 2881–2894. [Google Scholar]
- Reghunath, R.; Murthy, T.R.S.; Raghavan, B.R. The utility of multivariate statistical techniques in hydrogeochemical studies: An example from Karnataka, India. Water Res. 2002, 36, 2437–2442. [Google Scholar] [CrossRef]
- Singh, K.P.; Malik, A.; Sinha, S. Water quality assessment and apportionment of pollution sources of Gomti river (India) using multivariate statistical techniques: A case study. Anal. Chim. Acta 2005, 538, 355–374. [Google Scholar] [CrossRef]
- Gatica, E.A.; Almeida, C.A.; Mallea, M.A.; Del Corigliano, M.C.; González, P. Water quality assessment, by statistical analysis, on rural and urban areas of Chocancharava river (Río Cuarto), Córdoba, Argentina. Environ. Monit. Assess. 2012, 184, 7257–7274. [Google Scholar] [CrossRef] [PubMed]
- Chen, C.T.; Wang, S.L.; Wang, B.J.; Pai, S.C. Nutrient budgets for the South China Sea basin. Mar. Chem. 2001, 75, 281–300. [Google Scholar] [CrossRef]
- Fan, X.; Cui, B.; Zhao, H.; Zhang, Z.; Zhang, H. Assessment of river water quality in Pearl River Delta using multivariate statistical techniques. Procedia Environ. Sci. 2010, 2, 1220–1234. [Google Scholar] [CrossRef]
- Wu, Y.; Chen, J. Investigating the effects of point source and nonpoint source pollution on the water quality of the East River (Dongjiang) in South China. Ecol. Indic. 2013, 32, 294–304. [Google Scholar] [CrossRef]
- Department of Environmental Protection of Guangdong Province (DEPGP). 2015 Report on the State of Guangdong Provincial Environment; Department of Environmental Protection of Guangdong Province: Guangzhou, China, 2016. (In Chinese)
- Wu, M.; Ou, M.; Liao, R. Analysis on land use change and its driving forces in the developed area—a case study of Guangdong province. Res. Soil Water Conserv. 2012, 19, 179–183. (In Chinese) [Google Scholar]
- Liu, J.; Wu, H.; Feng, J.; Li, Z.; Lin, G. Heavy metal contamination and ecological risk assessments in the sediments and zoobenthos of selected mangrove ecosystems, South China. Catena 2014, 119, 136–142. [Google Scholar] [CrossRef]
- State Environmental Protection Administration of China (SEPA). Environmental Quality Standards for Surface Water of China (GB 3838-2002); State Environmental Protection Administration of China: Beijing, China, 2002. (In Chinese)
- Varol, M. Dissolved heavy metal concentrations of the Kralkizi, Dicle and Batman dam reservoirs in the Tigris River basin, Turkey. Chemosphere 2013, 93, 954–962. [Google Scholar] [CrossRef] [PubMed]
- Solidoro, C.; Pastres, R.; Cossarini, G.; Ciavatta, S. Seasonal and spatial variability of water quality parameters in the lagoon of Venice. J. Mar. Syst. 2004, 51, 7–18. [Google Scholar] [CrossRef]
- Department of Environmental Protection of Guangdong Province (DEPGP). Comprehensive Treatment of Water Environment in Watershed of LianJiang River; Department of Environmental Protection of Guangdong Province: Guangzhou, China, 2015. (In Chinese)
- Wan, X.; Han, J.; Xu, L.; Zhang, Q. Spatial and seasonal variations of the contamination within water body of the Grand Canal, China. Environ. Pollut. 2010, 158, 1513–1520. [Google Scholar]
- Ngoye, E.; Machiwa, J.F. The influence of land-use patterns in the Ruvu River watershed on water quality in the river system. Phys. Chem. Earth 2004, 29, 1161–1166. [Google Scholar] [CrossRef]
- Hong, H.C.; Wong, M.H.; Mazumder, A.; Liang, Y. Trophic state, natural organic matter and disinfection by-product formation potential of drinking water reservoirs around Pearl River Delta Region (China). J. Hydrol. 2008, 359, 164–173. [Google Scholar] [CrossRef]
- Turner, R.E.; Rabalais, N.N.; Justic, D.; Dortch, Q. Global patterns of dissolved N, P and Si in large rivers. Biogeochemistry 2003, 64, 297–317. [Google Scholar] [CrossRef]
- Duan, S.W.; Xu, F.; Wang, L.J. Long-term changes in nutrient concentrations of the Changjiang River and principal tributaries. Biogeochemistry 2007, 85, 215–234. [Google Scholar] [CrossRef]
- Conley, D.J.; Paer, H.W.; Howarth, R.W.; Boesch, D.F.; Seitzinger, S.P.; Havens, K.E.; Lancelot, C.; Likens, G.E. Controlling eutrophication: Nitrogen and phosphorus. Science 2009, 323, 1014–1015. [Google Scholar] [CrossRef] [PubMed]
- Bu, H.; Zhang, Y.; Meng, W.; Song, X. Effects of land-use patterns on in-stream nitrogen in a highly-polluted river basin in Northeast China. Sci. Total Environ. 2016, 553, 232–242. [Google Scholar] [CrossRef] [PubMed]
- Liu, W.; Zhang, Q.; Liu, G. Influences of watershed landscape composition and configuration on lake-water quality in the Yangtze River basin of China. Hydrol. Process. 2012, 26, 570–578. [Google Scholar] [CrossRef]
- Ye, Y.; Zhang, J.; Chen, L.; Qin, Z.; Zhao, B. Carbon sequestration by agricultural land and its spatio-temporal characteristics in Guangdong province from 1996 to 2012. J. Soil Water Conserv. 2014, 28, 139–146. (In Chinese) [Google Scholar]
- Xu, Q.; Hunag, Z.; Wang, X.; Cui, L. Pennisetum sinese Roxb and Pennisetum purpureum Schum. as vertical-flow constructed wetland vegetation for removal of N and P from domestic sewage. Ecol. Eng. 2015, 83, 120–124. [Google Scholar] [CrossRef]
- Zhang, L.; Wong, M.H. Environmental mercury contamination in China: Sources and impacts. Environ. Int. 2007, 33, 108–121. [Google Scholar] [CrossRef] [PubMed]
Figure 1.
The sampling locations of 27 subtropical rivers draining into the South China Sea.

Figure 2.
Spatial patterns of water nutrients (mean ± SD) in 27 subtropical rivers, China. River names are given in Figure 1.
Figure 2.
Spatial patterns of water nutrients (mean ± SD) in 27 subtropical rivers, China. River names are given in Figure 1.


Figure 3.
Spatial patterns of water heavy metals (mean ± SD) in 27 subtropical rivers, China. River names are given in Figure 1.
Figure 3.
Spatial patterns of water heavy metals (mean ± SD) in 27 subtropical rivers, China. River names are given in Figure 1.


Figure 4.
Dendrogram from spatial cluster analysis based on water quality parameters for 27 subtropical rivers, China. River names are given in Figure 1.
Figure 4.
Dendrogram from spatial cluster analysis based on water quality parameters for 27 subtropical rivers, China. River names are given in Figure 1.

Figure 5.
Seasonal dynamics of water nutrients (mean ± SD) in 27 subtropical rivers, China.


Figure 6.
Seasonal dynamics of water heavy metals (mean ± SD) in 27 subtropical rivers, China.


Table 1.
Summary statistics of nutrient and heavy metal concentrations in surface water of subtropical rivers (N = 27), and environmental quality standard for surface water in China.
Table 1.
Summary statistics of nutrient and heavy metal concentrations in surface water of subtropical rivers (N = 27), and environmental quality standard for surface water in China.
| Water Quality Parameters | Abbr | Median | Mean ± SD | Max | Min | Environmental Quality Standard a |
|---|---|---|---|---|---|---|
| Nutrients (mg/L) | ||||||
| Permanganate index | IMn | 3.32 | 4.49 ± 5.17 | 45.0 | 0.50 | 6 |
| Chemical oxygen demand | COD | 12.4 | 18.1 ± 22.3 | 201 | 5.00 | 20 |
| Biochemical oxygen demand | BOD5 | 2.04 | 3.68 ± 6.43 | 61.8 | 0.50 | 4 |
| Ammonia | NH4+ | 0.28 | 1.11 ± 2.42 | 15.8 | 0.00 | 1.0 |
| Nitrate | NO3− | 1.17 | 1.35 ± 1.19 | 9.55 | 0.06 | 10 b |
| Total nitrogen | TN | 2.15 | 2.94 ± 3.28 | 24.1 | 0.35 | 1.0 |
| Total phosphorus | TP | 0.09 | 0.22 ± 0.44 | 3.34 | 0.02 | 0.2 |
| Heavy metals (μg/L) | ||||||
| Mercury | Hg | 0.04 | 0.04 ± 0.02 | 0.11 | 0.01 | 0.10 |
| Lead | Pb | 1.00 | 2.39 ± 3.39 | 22 | 0.05 | 50 |
| Copper | Cu | 1.30 | 3.94 ± 9.06 | 93 | 0.1 | 1000 |
| Zinc | Zn | 9.78 | 20.6 ± 20.8 | 100 | 0.5 | 1000 |
| Selenium | Se | 0.50 | 1.27 ± 1.52 | 11.3 | 0.09 | 10 |
| Arsenic | As | 1.60 | 2.72 ± 2.51 | 7 | 0.2 | 50 |
| Cadmium | Cd | 0.65 | 0.50 ± 0.40 | 1 | 0.02 | 5.0 |
| Chromium | Cr | 4.00 | 4.06 ± 0.76 | 12 | 2 | 50 |
| Iron | Fe | 86.7 | 110 ± 90.9 | 492 | 1.5 | 300 b |
| Manganese | Mn | 10.0 | 36.2 ± 62.4 | 430 | 0.3 | 100 b |
Notes: a Grade III of the environmental quality standards for surface water in China (GB 3838-2002). b The limit values for centralized drinking water sources in China.
Table 2.
Statistical test (t-test) results of river nutrient and heavy metal concentrations between two spatial clusters as well as between two seasons.
Table 2.
Statistical test (t-test) results of river nutrient and heavy metal concentrations between two spatial clusters as well as between two seasons.
| Water Quality Parameters | Cluster A (N = 23) | Cluster B (N = 3) | Cluster C (N = 1) | Dry Season (N = 6) | Wet Season (N = 6) |
|---|---|---|---|---|---|
| Nutrients (mg/L) | |||||
| IMn | 3.23 ± 1.05 * | 8.26 ± 1.52 * | 25.1 | 4.89 ± 0.83 | 4.18 ± 0.25 |
| COD | 12.8 ± 2.83 * | 31.8 ± 3.34 * | 112 | 19.9 ± 2.95 * | 16.5 ± 1.23 * |
| BOD5 | 2.18 ± 0.82 * | 6.48 ± 1.64 * | 30.1 | 4.21 ± 0.86 * | 3.26 ± 0.45 * |
| NH4+ | 0.40 ± 0.33 * | 4.59 ± 3.00 * | 8.84 | 1.25 ± 0.34 | 1.00 ± 0.35 |
| NO3− | 1.24 ± 0.67 | 1.50 ± 0.94 | 1.26 | 1.43 ± 0.28 | 1.29 ± 0.33 |
| TN | 1.96 ± 1.13 * | 8.32 ± 3.37 * | 11.5 | 3.22 ± 0.66 | 2.72 ± 0.54 |
| TP | 0.11 ± 0.06 * | 1.52 ± 1.02 * | 1.00 | 0.23 ± 0.08 | 0.21 ± 0.07 |
| Heavy metals (μg/L) | |||||
| Hg | 0.04 ± 0.02 | 0.02 ± 0.02 | 0.07 | 0.03 ± 0.00 * | 0.04 ± 0.00 * |
| Pb | 2.41 ± 3.12 | 2.61 ± 2.31 | 3.33 | 2.01 ± 0.67 | 2.47 ± 0.60 |
| Cu | 2.97 ± 4.11 | 9.43 ± 11.26 | 10.3 | 4.32 ± 1.35 | 3.34 ± 1.48 |
| Zn | 20.7 ± 20.49 | 10.9 ± 11.2 | 32.2 | 18.9 ± 2.42 | 20.5 ± 2.11 |
| Se | 1.00 ± 0.99 | 1.71 ± 2.53 | 3.00 | 1.34 ± 0.38 | 1.11 ± 0.13 |
| As | 2.41 ± 2.28 | 1.53 ± 2.22 | 7.00 | 2.66 ± 0.36 | 2.58 ± 0.26 |
| Cd | 0.52 ± 0.40 | 0.21 ± 0.25 | 0.70 | 0.45 ± 0.08 | 0.51 ± 0.04 |
| Cr | 3.99 ± 0.61 * | 2.64 ± 0.43 * | 4.00 | 3.85 ± 0.19 | 3.90 ± 0.25 |
| Fe | 103 ± 55.5 * | 54.3 ± 48.7 * | 232 | 110 ± 24.7 | 101±15.1 |
| Mn | 22.3 ± 30.8 * | 60.4 ± 85.4 * | 184 | 37.4 ± 14.0 | 32.9 ± 4.45 |
Note: Mean ± SD followed by an asterisk indicates a significant difference (p < 0.05) between cluster A and B or between wet season (from April to September) and dry season (from October to next March).
Table 3.
Rotated component loadings of the first four principal components based on water nutrients and heavy metals.
Table 3.
Rotated component loadings of the first four principal components based on water nutrients and heavy metals.
| Water Quality Parameters | Component | |||
|---|---|---|---|---|
| PC1 | PC2 | PC3 | PC4 | |
| IMn | 0.96 | 0.06 | 0.09 | 0.09 |
| COD | 0.97 | 0.12 | 0.12 | 0.06 |
| BOD5 | 0.96 | 0.08 | 0.08 | 0.02 |
| NH4+ | 0.88 | −0.13 | −0.06 | 0.33 |
| NO3− | 0.16 | −0.80 | −0.05 | 0.02 |
| TN | 0.83 | −0.35 | −0.06 | 0.29 |
| TP | 0.56 | −0.18 | −0.08 | 0.69 |
| Hg | 0.26 | 0.66 | 0.16 | 0.01 |
| Pb | −0.03 | 0.45 | 0.44 | 0.72 |
| Cu | 0.18 | 0.19 | −0.25 | 0.77 |
| Zn | 0.06 | 0.23 | 0.86 | 0.00 |
| Se | 0.50 | −0.04 | −0.40 | −0.21 |
| As | 0.38 | 0.41 | −0.59 | −0.22 |
| Cd | −0.08 | 0.78 | −0.03 | 0.34 |
| Cr | 0.03 | 0.04 | 0.21 | 0.14 |
| Fe | 0.34 | −0.11 | 0.79 | −0.36 |
| Mn | 0.79 | −0.05 | −0.03 | −0.18 |
| Eigenvalues | 6.18 | 3.16 | 2.40 | 2.00 |
| Percentage of variance | 36.35 | 18.61 | 14.13 | 11.77 |
| Cumulative percentage of variance | 36.35 | 54.97 | 69.10 | 80.87 |
Table 4.
Matrix of Pearson correlation coefficients for water nutrient and heavy metal parameters.
| Water Quality Parameters | IMn | COD | BOD5 | NH4+ | NO3− | TN | TP | Hg | Pb | Cu | Zn | Se | As | Cd | Cr | Fe | Mn |
|---|---|---|---|---|---|---|---|---|---|---|---|---|---|---|---|---|---|
| IMn | 1 | ||||||||||||||||
| COD | 0.98 ** | 1 | |||||||||||||||
| BOD5 | 0.97 ** | 0.99 ** | 1 | ||||||||||||||
| NH4+ | 0.86 ** | 0.84 ** | 0.85 ** | 1 | |||||||||||||
| NO3− | 0.07 | 0.05 | 0.09 | 0.27 | 1 | ||||||||||||
| TN | 0.77 ** | 0.75 ** | 0.75 ** | 0.94 ** | 0.48 ** | 1 | |||||||||||
| TP | 0.58 ** | 0.52 ** | 0.45 * | 0.69 ** | 0.16 | 0.69 ** | 1 | ||||||||||
| Hg | 0.30 | 0.31 | 0.28 | 0.22 | −0.26 | 0.10 | −0.03 | 1 | |||||||||
| Pb | 0.09 | 0.13 | 0.08 | 0.11 | −0.36 | 0.00 | 0.34 | 0.28 | 1 | ||||||||
| Cu | 0.25 | 0.22 | 0.18 | 0.32 | −0.14 | 0.23 | 0.57 ** | 0.07 | 0.52 ** | 1 | |||||||
| Zn | 0.10 | 0.15 | 0.12 | −0.06 | −0.26 | −0.12 | −0.07 | 0.18 | 0.51 ** | −0.03 | 1 | ||||||
| Se | 0.30 | 0.34 | 0.38 | 0.51 ** | 0.38 | 0.58 ** | 0.12 | 0.31 | −0.33 | −0.12 | −0.29 | 1 | |||||
| As | 0.24 | 0.30 | 0.32 | 0.25 | −0.03 | 0.21 | −0.05 | 0.40 * | −0.18 | 0.20 | −0.29 | 0.75 ** | 1 | ||||
| Cd | 0.00 | 0.04 | 0.02 | −0.03 | −0.56 * | −0.20 | 0.10 | 0.47 * | 0.58 ** | 0.19 | 0.02 | −0.07 | 0.17 | 1 | |||
| Cr | 0.08 | 0.07 | −0.03 | −0.18 | −0.32 | −0.20 | 0.37 | −0.36 | 0.24 | 0.20 | 0.34 | −0.52 ** | −0.31 | 0.00 | 1 | ||
| Fe | 0.36 | 0.39 * | 0.34 | 0.09 | 0.08 | 0.14 | −0.04 | 0.09 | 0.03 | −0.38 | 0.65 ** | −0.12 | −0.29 | −0.24 | 0.27 | 1 | |
| Mn | 0.67 ** | 0.69 ** | 0.71 ** | 0.72 ** | 0.30 | 0.74 ** | 0.25 | 0.35 | −0.18 | −0.07 | 0.02 | 0.73 ** | 0.48 ** | −0.14 | −0.36 | 0.22 | 1 |
Notes: * p < 0.05; ** p < 0.01.
© 2018 by the authors. Licensee MDPI, Basel, Switzerland. This article is an open access article distributed under the terms and conditions of the Creative Commons Attribution (CC BY) license (http://creativecommons.org/licenses/by/4.0/).
Share and Cite
MDPI and ACS Style
Deng, A.; Ye, C.; Liu, W. Spatial and Seasonal Patterns of Nutrients and Heavy Metals in Twenty-Seven Rivers Draining into the South China Sea. Water 2018, 10, 50. https://doi.org/10.3390/w10010050
AMA Style
Deng A, Ye C, Liu W. Spatial and Seasonal Patterns of Nutrients and Heavy Metals in Twenty-Seven Rivers Draining into the South China Sea. Water. 2018; 10(1):50. https://doi.org/10.3390/w10010050
Chicago/Turabian StyleDeng, Amei, Changdong Ye, and Wenzhi Liu. 2018. "Spatial and Seasonal Patterns of Nutrients and Heavy Metals in Twenty-Seven Rivers Draining into the South China Sea" Water 10, no. 1: 50. https://doi.org/10.3390/w10010050
Note that from the first issue of 2016, this journal uses article numbers instead of page numbers. See further details here.