Article

Role of Seawater Desalination in the Management of an Integrated Water and 100% Renewable Energy Based Power Sector in Saudi Arabia

School of Energy Systems, Lappeenranta University of Technology, Skinnarilankatu 34, 53850 Lappeenranta, Finland
*
Author to whom correspondence should be addressed.
Water 2018, 10(1), 3; https://doi.org/10.3390/w10010003
Submission received: 19 November 2017 / Revised: 19 December 2017 / Accepted: 20 December 2017 / Published: 22 December 2017
(This article belongs to the Special Issue Sustainable Water Supply through Desalination and Wastewater Reuse)

Abstract

:
This work presents a pathway for Saudi Arabia to transition from the 2015 power structure to a 100% renewable energy-based system by 2050 and investigates the benefits of integrating the power sector with the growing desalination sector. Saudi Arabia can achieve 100% renewable energy power system by 2040 while meeting increasing water demand through seawater reverse osmosis (SWRO) and multiple effect distillation (MED) desalination plants. The dominating renewable energy sources are PV single-axis tracking and wind power plants with 243 GW and 83 GW, respectively. The levelised cost of electricity (LCOE) of the 2040 system is 49 €/MWh and decreases to 41 €/MWh by 2050. Corresponding levelised cost of water (LCOW) is found to be 0.8 €/m3 and 0.6 €/m3. PV single-axis tracking dominates the power sector. By 2050 solar PV accounts for 79% of total electricity generation. Battery storage accounts for 41% of total electricity demand. In the integrated scenario, due to flexibility provided by SWRO plants, there is a reduced demand for battery storage and power-to-gas (PtG) plants as well as a reduction in curtailment. Thus, the annual levelised costs of the integrated scenario is found to be 1–3% less than the non-integrated scenario.

1. Introduction

The Kingdom of Saudi Arabia (KSA) is the largest country in the Arabian Peninsula and is the 13th largest in the world. As of 2015, the Kingdom had a population of approximately 31,540,000—the highest among the Gulf Cooperation Council (GCC) countries [1,2]. Located between the Persian Gulf and the Red Sea, Saudi Arabia is also one of the largest arid countries without any permanent rivers or lakes. While the global average renewable water resource per capita per year is 6000 m3, Saudi Arabia has only 84.8 m3/(capita∙a) [3]. In spite of the water scarcity, Saudi Arabia has the third highest water consumption per capita at 250 L/(capita∙d) [3]. This is only behind the United States and Canada. The country’s water demand is expected to increase by 56% by 2035. Meanwhile, at the current rate of water withdrawal, ground water aquifers are expected to provide potable water only for the next 10–30 years [4].
To augment the fresh water resources, Saudi Arabia relies on seawater desalination, particularly to meet the municipal and industrial water demands. In 2010, 58% of the country’s total water demand was met through non-renewable ground water resources, 33.5% by surface water and renewable ground water, 6% by desalinated water and 2.2% by waste water reuse [5]. In 2014, desalinated water is estimated to have met 60% of KSA’s municipal water demand [6]. By the end of 2015, Saudi Arabia accounted for 15% of the global installed desalination capacity [5]. With the diminishing of fresh water resources, seawater desalination is expected to play a pivotal role in meeting Saudi Arabia’s future water demands. However, desalination is an energy intensive process compared to traditional water treatment methods. Saudi Arabia is reported to use 25% of the domestic oil and gas production in desalination plants and the share is expected to increase to 50% by 2030 [7]. A report by General Electric (GE) suggests that Saudi Arabia requires 300,000 barrels of oil per day for the desalination plants on the country’s Eastern and Western coasts [8].
Saudi Arabia has 1/5th of the world’s proven oil reserves and is the largest producer and exporter of petroleum products [9]. In addition, KSA is the 9th largest exporter of natural gas [9]. Saudi Arabia’s economy is based on oil revenues and during the time period 2010–2013, oil revenues contributed up to 91% of the country’s national income [10]. This is reflected in the recent low oil prices and the resulting slower growth of the Saudi economy. Al Bassam [10] explains that although the government has had plans to diversify the economy and decouple economic growth from oil, there has in fact been an increase in dependence on oil revenues over the last few years. In addition to the low oil prices, growing concern is the share of local fossil fuel reserves, driven by increasing income and population, being used to meet the country’s energy demand. According to the King Abdullah City for Atomic and Renewable Energy (KACARE) [11], the country’s demand for fossil fuels is expected to grow from 3.8 million barrels of oil equivalent in 2010 to 8.3 million barrels of oil equivalent in 2028. Moser et al. [12] suggests that at the current rate of consumption, Saudi Arabia could become an oil importer by 2030. By 2015, Saudi Arabia’s power plants capacities were almost equally separated into oil-based thermal power plants and gas-based power plants [13].
Economic reforms have been discussed in the past but it is only recently that reforms have been discussed with haste. A report in the Guardian [14] suggests that swift actions were triggered by the 100 billion € deficit the Saudi government incurred in 2015. Consequently, in April 2016, King Salman bin Abdulaziz presented details of the Saudi vision 2030 plan and heralded a Saudi future without oil [14]. A key component of the new vision is the growth of Saudi Arabia’s renewable energy sector for both power and water desalination. It is planned to have 9.5 GW of renewable capacity by 2023, as an initial stage to meet the country’s increasing energy demands [15]. According to a recent article [16], the Saudi Energy Minister has discussed the Kingdom’s visions to push installed renewable energy (RE) capacities higher to 10 GW by 2023.
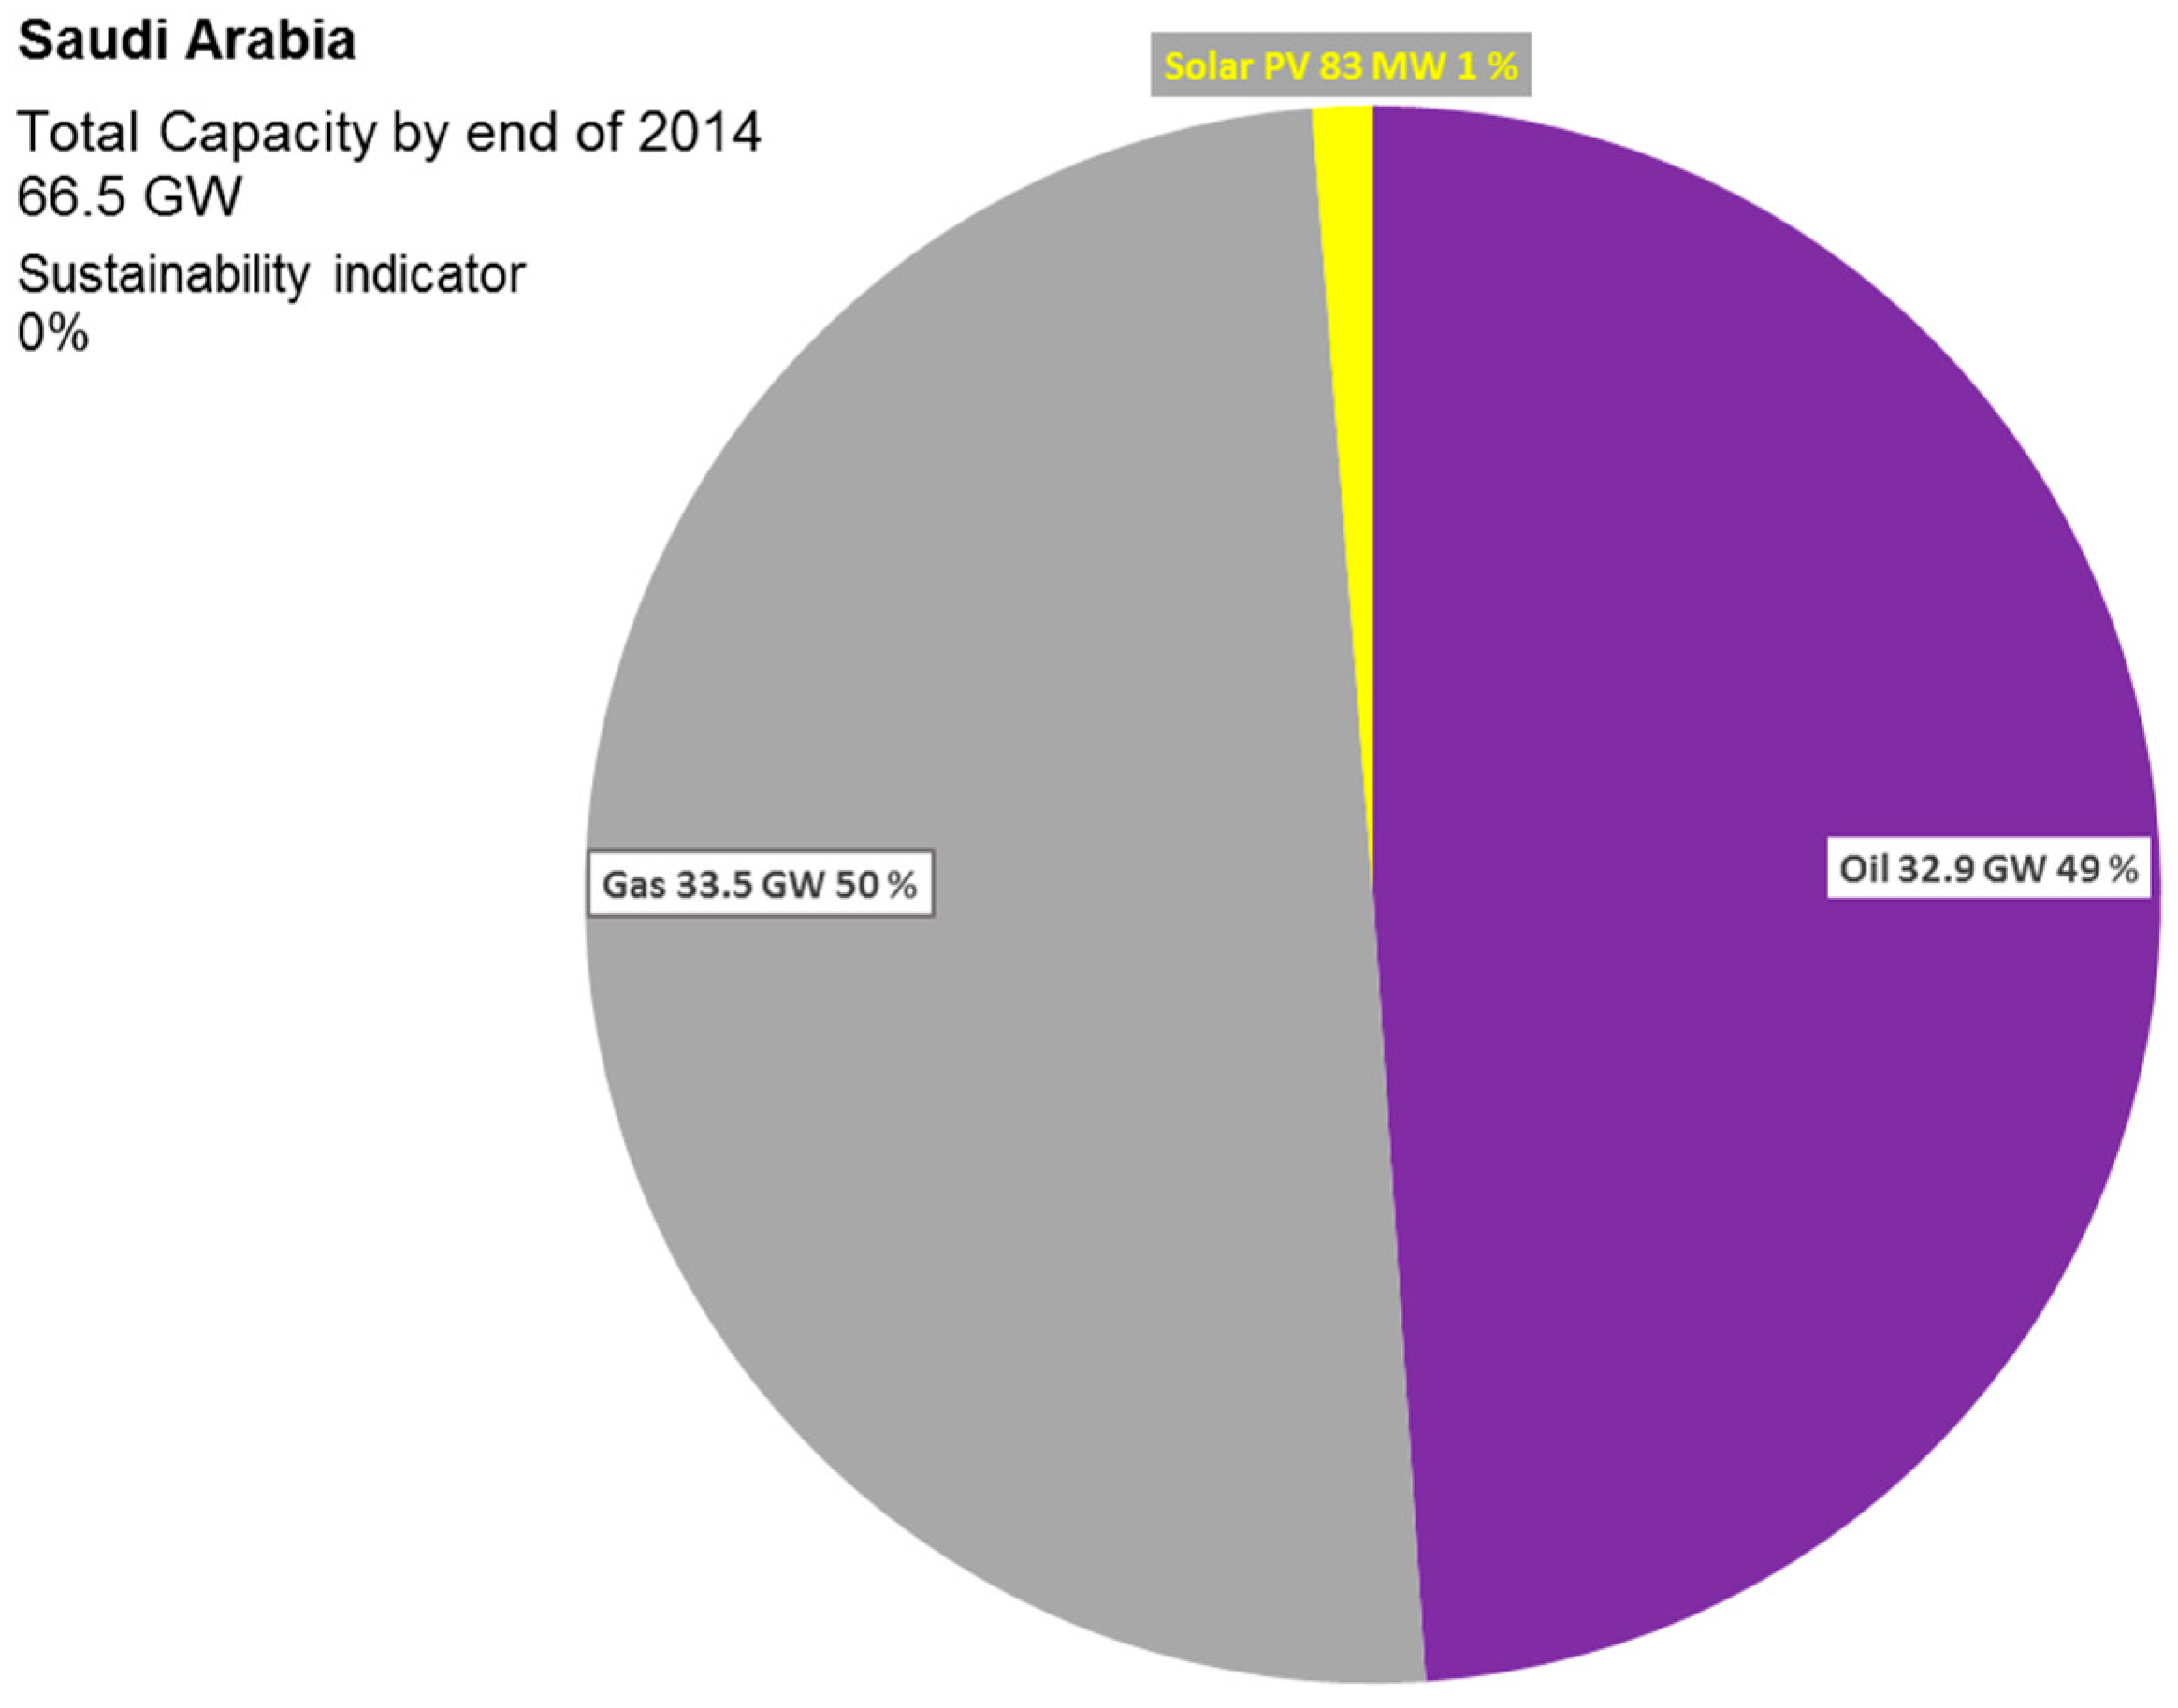
In spite of the country’s wealth of solar and wind resources, Saudi Arabia had only 83 MW of renewable power plants, all solar photovoltaic installations, by early 2015 [13]. Figure 1 presents the total installed capacities, by the beginning of 2015, in Saudi Arabia and illustrates the almost complete reliance on oil and gas in the current power sector [13]. The country lies within the sunbelt region of the world and the average population weighted global horizontal irradiation is estimated to be 2158 kWh/(m2∙a) [17,18]. According to Yamada [19], the potential for solar energy in Saudi Arabia is finally being acknowledged with the Saudi government referring to solar energy as ‘yellow oil’. The recent bids for 300 MW of solar PV in Saudi Arabia is set to end with an electricity production cost as low as 1.78 USD cents/kWh—the lowest bid to date [20]. With 7 out of the 8 bids placed for the 300 MW installation being less than 3 USD cents/kWh, the new threshold for large scale projects in the MENA region is being discussed to be as little as 3 USD cents/kWh [21]. Further to these developments, the Saudi Public Investment Fund together with the SoftBank Vision Fund, has confirmed the construction of a 3 GW solar and storage project in 2018 [22]. This would enable to meet one-third of Saudi Arabia’s renewable energy capacity of 9.5 GW by 2023.
Table 1 illustrates the energy consumption of the most prevalent desalination technologies in Saudi Arabia [23]. In the past, Saudi Arabia has relied on thermal desalination technologies. However, due to the lower energy consumption and improvement in technology, reverse osmosis is expected to dominate the Saudi market in the future [5].
In Caldera et al. [24], it was shown that the global water demand of 2030 can be met by seawater reverse osmosis (SWRO) plants powered by 100% hybrid renewable energy power plants at a cost level competitive with that of fossil powered SWRO plants today. This system eliminates the reliance of SWRO desalination plants on non-renewable fossil fuels and concerns about greenhouse gas emissions. Meanwhile, reflecting the Saudi government’s vision of high renewable energy capacities, there is recent literature that discusses the 100% renewable energy transition of different countries and regions [25,26,27,28,29,30,31,32], as well as detailed visualization of respective electricity systems [33].
In this paper, motivated by the growing demand for seawater desalination in Saudi Arabia and transition towards 100% renewable energy power systems, we pose the following research question: What are the impacts on Saudi Arabia’s electricity and water production costs when the seawater desalination demand is integrated into the country’s 100% renewable energy (RE)-based power sector? The energy transition pathway, for Saudi Arabia, from the current fossil-based power system to a 100% RE-based system is first found. Then, the seawater desalination demand is integrated into the power system, to understand the impacts on the cost of the power and water sectors. The excess heat present in the energy system is utilized for the thermal desalination plants during the transition
In addition, the transition accounts for the non-energetic industrial gas demand of Saudi Arabia. During the transition, the non-energy demand for natural gas by the Saudi industry is increasingly met through synthetic natural gas production (SNG). Power to gas plants (PtG) are used to produce SNG from renewable electricity generation [34,35] and integrated into the power system. During the production of the SNG, there may be excess heat produced that can contribute to the operation of thermal desalination plants.
Thus, the results will present an optimal transition path for Saudi Arabia to manage the country’s future electricity, water and gas demands through a 100% RE system.

2. Methodology

2.1. Overview

The key objective of our work is to understand the role that seawater desalination can play in the optimal transition of Saudi Arabia’s 2015 power sector a 100% renewable energy power sector by 2050. The approach that was taken to answer this research question can be summarized as follows:
  • The energy transition from the current (as of the beginning of 2015) fossil-based power system in KSA to a 100% renewable energy-based power system by 2050, in 5 year time steps, is found. After 2015, there are no new fossil powered thermal plants allowed in order to achieve the target of a 100% RE-based power system. The existing fossil-based power systems are phased out based on their lifetimes. The increase in total electricity demand and population over the years is accounted for. The optimal mix of renewable power systems to replace the phased out fossil power systems are found and the resulting system’s levelised cost of electricity (LCOE) is found for every time step.
  • The non-energy industrial gas demand of Saudi Arabia, from 2015 to 2050 is found and integrated into the power system. Figure 6 presents the projected growth in the industrial gas demand in Saudi Arabia. To attain a 100% renewable energy future, our work assumes that over time the industrial gas demand is met from synthetic natural gas (SNG). This can be achieved through power-to-gas plants (PtG) that comprise of two processes already used in industry: electrolysis and methanation [34,35]. PtG plants convert renewable electricity to renewable methane that can be stored in the existing gas infrastructure and used as conventional natural gas or for the industry.
  • Seawater desalination demand in KSA from 2015 to 2050 is determined and the corresponding desalination capacities integrated into the system. After 2015, the model is allowed to only install SWRO plants. This is based on the increasing dominance of the technology in the Saudi Arabian desalination market. MED plants are considered due to the low thermal consumption and lower electricity demand than SWRO [23,36]. The heat from the power system is used to meet the thermal demand of MED plants. Multi stage flash (MSF) desalination capacities that were online up to 2015 are included and phased out based on the lifetimes. MSF stand alone plants are excluded due to the relatively higher thermal consumption compared to MED plants [23,36]. In addition, MED and MSF cogeneration plants are excluded due to the requirement for fossil powered thermal power plants [37]. According to a Water Desalination Report [38], the Ras Al Khair IWPP plant, the largest desalination plant in the world, is expected to be the last new MSF plant in KSA.
  • The energy transition for KSA from the 2015 fossil-based power system to the 100% renewable energy-based power system by 2050 is found with the gas sector and seawater desalination integrated. Ultimately, the total cost of the power, gas and water sectors are compared to determine the impacts of integrated seawater desalination in the energy system.
For the design and analysis of the energy transition, the energy model, used and further developed at LUT, is used [29,39,40,41]. The LUT Energy System Transition model is based on the linear optimization method with interior point optimization, and is designed in an hourly temporal and 0.45° × 0.45° spatial resolution. The energy model allows for the design of local, national, regional or global energy systems. It is composed of all relevant power generation and storage technologies, respective installed capacities and different operation modes of these technologies. A key feature of the model is its flexibility and expandability besides the hourly resolution for a full real year.
The sections that follow present an overview of the technical and financial assumptions of the energy model, the power plants and seawater desalination plants. The data assumed for the time period from 2015–2050 are presented.

2.2. Model Overview

A key requirement of the LUT Energy Systems model is to match the power generation and demand for every hour of the applied year. The hourly modeling enables a more accurate system description including synergy effects of different system components for power system balance [29]. The aim of the system optimization is to minimize the total annual cost of the installed capacities of the different technologies, cost of energy generation and generation ramping. The full description of the model, its input data including RE resources and technical assumptions can be found in Bogdanov and Breyer [29] and Barbosa et al. [39].
The three main components of the energy model can be listed as:
  • Technologies for the conversion of RE into electricity;
  • Energy storage technologies;
  • Energy sector bridging technologies enable the coupling of different electricity demand sectors. This provides further flexibility to the complete energy system, bringing down the overall system cost.
Aghahosseini et al. [40] describe the various components of the LUT Energy System model and how the model determines the optimal 100% renewable energy mix for Iran for the year 2030.
For Saudi Arabia, the model described by Aghahosseini et al. [40] was modified with the addition of thermal desalination technologies as another desalination technologies and a subsequent energy transition, i.e., the system setup found for one period had been adjusted by the capacities being beyond their technical lifetime as a starting value for incremental optimization for the new period. Figure 2 illustrates the modified energy model. For the energy transition, the model determines the optimal combination of the components that meets the electricity demand of every hour for the time period from 2015 to 2050, in 5 year time steps.

2.3. Power Plant Capacities—Technical and Financial Assumptions

The average rate of increase in electricity demand in KSA is 6% and as of 2015, for a total population of 32,540,000, the total electricity consumption of the country was 289 TWh [42,43]. To determine the future energy system, the forecasted total energy demand numbers are required. The International Energy Agency assumes a compound annual growth rate of 2.7% for the Middle East [44]. This growth rate was applied to Saudi Arabia to project the future electricity consumption, as presented in Table 2. Figure 3 illustrates the hourly load profile for Saudi Arabia assumed for 2015 [42,43]. As expected, during the summer period of May to September, the highest loads occur. For the subsequent time periods, the load profile presented is varied depending on the total electricity consumption for the period. The capacity factor on the right y-axis indicates the percentage of the maximum load that is being required for a given point in time.
The model takes the 2015 installed power plant capacities, presented in Figure 1, corresponding lifetimes, total electrical energy demand, and optimizes the mix of renewable energy plants needed to be installed to achieve a 100% renewable energy power system by 2050. The optimization for each time period is carried out on basis of assumed costs and technological status of the renewable energy technologies. In the integrated scenario, the RE plants are optimized to also cater for the energy demands of the desalination and gas sectors.
The capital expenditures (capex), operational expenditures (opex) and efficiency variations of all the power sector components, from 2015 up to 2050, assumed in the model are presented in Appendix A (Table A1 and Table A3). Figure 4 is a visual representation of the capex numbers. A learning curve approach based on several references, is used to identify the variation in capex for the different components. The references for the different components are presented in the Appendix A (Table A1).
The capex and opex numbers generally refer to a kW of electrical power. For the case of water electrolysis the capex and opex numbers refer to a kW of hydrogen thermal combustion energy, and for CO2 direct air capture, methanation and gas storage to a kW of methane thermal combustion energy. The financial assumptions for storage systems refer to a kWh of electricity, and gas storage refers to a thermal kWh of methane at the lower heating value. Weighted average cost of capital (WACC) is set to 7% for all years. The technical assumptions concerning power to energy ratios for storage technologies, and efficiency numbers for generation and storage technologies are provided in the Appendix A (Table A1 and Table A2).
To determine the capacities of the different renewable energy power plant components, it is necessary to understand the local resources available. The solar irradiation components and wind speed data, in a 0.45° × 0.45° spatial and hourly temporarily resolution, is obtained from the NASA [45,46] and reprocessed by the German Aerospace Center [29]. The wind speed data is provided for a height of 50 m. In the LUT Energy Systems model, due to higher performance, ENERCON 3 MW wind turbines (E-101, Enercon, Aurich, Germany), with a hub height of 150 m, are used [29]. The wind speed data from the German Aerospace Center is converted to the relevant wind speed at 150 m using the logarithmic wind shear law [29]. The approach discussed by Aghahosseini et al. [40] is used to identify the biomass and geothermal potential available in KSA. Table 3 presents the biomass and geothermal potential results for KSA and it is assumed that these are the amounts available for every time period from 2015 to 2050.
Feed-in full load hours (FLH) for Saudi Arabia is also computed, as described in Bogdanov and Breyer [29], on the basis of the 0.45° × 0.45° spatially resolved data. The average FLH for CSP solar field, PV optimally tilted, PV single-axis tracking and wind power plants in Saudi Arabia are presented in Table 4. The average full load hours represent the number of hours in a year with the equivalent maximum generation for the annually obtained yield, which is identical to the capacity factor derived by the average full load hours divided by 8760, the numbers of all hours in a year. Wind energy has the highest FLH, followed by PV single-axis tracking, CSP solar field and PV optimally tilted. Figure 5 presents the aggregated profiles of CSP solar field, wind energy power generation, solar PV generation (optimally tilted and single-axis tracking). The profiles represent the weighted average of the RE resource available as a percentage of the total respective RE resource potential of the country.
The model specifies the upper limits and lower limits for the renewable energy power plant capacities. Lower limits are the installed capacities of renewable energy plants by 2015. For Saudi Arabia this is only 81.6 MW of solar PV plants as listed in Table 5. In periods after 2015, the lower limit is set to the capacity of the previous period adjusted by the capacities reached the end of their technical lifetime. The upper limits are calculated according to Bogdanov and Breyer [29] and the relevant results for KSA are listed in Table 6. For solid biomass residues, biogas and waste-to-energy plants it is assumed, due to energy efficiency reasons, that the available and specified amount of the fuel is used during the year.
Table A1 and Table A2, in the Appendix, provide detailed technical and financial assumptions, from 2015 to 2050, for the energy system components used in this research for Saudi Arabia.

2.4. Seawater Desalination Capacities—Technical and Financial Assumptions

Table 7 represents the total online capacities of seawater desalination in Saudi Arabia by 2015 [47].
The desalination capacity required for the time period from 2015–2050 is determined using the methodology described in Caldera et al. [24]. The approach is based on the water stress and the water demand values in Saudi Arabia for an optimistic future scenario. The desalination capacities are calculated assuming a 100% utilization of the available renewable water resource. The National Water Strategy (NWS) for Saudi Arabia outlines specific amounts of non-renewable water to be consumed from 2015 up to 2040, such that by 2040 there is 5 billion m3 of non-renewable water resource being withdrawn annually [48]. Therefore, the actual desalination demand also should take into account the usage of non-renewable water resources. For the model, the non-renewable water resource being withdrawn is deducted from the modelled desalination capacity to find the actual desalination capacity required. However, the non-renewable water resource numbers found in the NWS are based on a percentage of renewable water resource used. In the model, the desalination capacities are based on optimal use of the available renewable freshwater resource. As a result, the actual non-renewable water resource withdrawal decreases. This is ultimately used to find the actual desalination capacity required for the Kingdom of Saudi Arabia from 2015–2050. Table 8 represents the numbers and the final desalination capacities needed. In addition, the capacities online by 2015 are presented. This is less than the actual desalination demand in 2015. It has to be noted that other desalination technologies, such as brackish water reverse osmosis (BWRO), have been excluded from the present study. The desalination capacities in the following years are optimized by the model.
From 2015 onwards, SWRO and MED stand alone desalination plants are optimized to meet the increasing desalination demand. The thermal energy required for the MED stand alone plants are provided through excess heat in the system. The excess heat may be generated from the gas turbines, internal combustion generators, municipal waste incinerators and power-to-gas units. Based on the availability of heat in the system and the cost of required heat generation, the model optimizes the water production from MED stand alone plants.
MSF standalone plants are not installed after 2015. This is due to the higher thermal consumption compared to MED stand alone plants, as highlighted in Table 1. Similar to the MED stand alone plants, the already installed MSF standalone capacities utilize heat from the energy system. Mehzer et al. [49] explain the dependence of the MSF water production costs on the fuel cost. The water production cost has been reported to be 1 USD/m3 for an oil price of 20 USD/barrel and 4 USD/m3 for an unsubsidized oil price of 100 USD/barrel. As a result of technological improvements and lower energy consumption, Mehzer et al. [49] discuss the potential for MED to substitute MSF in future desalination markets. MED and MSF cogeneration plants online by 2015 are powered through natural gas, and depending on the cost effectiveness, the cogeneration plants are run to produce water and electricity. Gradually, the MSF desalination plants and MED cogeneration plants are decommissioned based on lifetime.
It has to be noted that there are other desalination technologies with smaller scale applications such as vapor compression and electro-dialysis [49,50]. There are more technologies being researched and developed such as forward osmosis and membrane distillation [46]. Gude and Nirmalakhandan [50,51] have developed a desalination technology that utilizes low grade heat, at about 60 °C, coupled with thermal energy storage, to produced potable water continuously. Meanwhile Inoue et al. [52] and Arnau et al. [53] present a means to desalinate and transport seawater using the difference in seawater and inland temperature. In this study, however, only the seawater desalination technologies that have the largest market shares and used in large scale applications are considered.
The technical and financial parameters of the desalination technologies from 2015–2050 are presented in the Appendix A (Table A2). Similarly, the capex, opex and energy consumption of the water transportation and water storage are presented. There is no variation in the latter numbers from the time period 2015 to 2050.
The future capex of the desalination technologies and the corresponding energy consumption was estimated as follows:

2.4.1. SWRO

  • Using the Global Water Intelligence (GWI) Desal Database, the average capex of plants of the capacity range of 10,000 m3/day up to 50,000 m3/day, contracted in all years from 1980–2015, was found [47]. It is assumed that all the plants to be built in Saudi Arabia in the future, would have a capacity of 50,000 m3/day or higher. Then, the methodology discussed by Loutatidou et al. [54] to determine the EPC costs for SWRO desalination plants up to 2030 was utilized. In our study, this methodology was used to estimate the capex costs for SWRO plants of a capacity 50,000 m3/day from 2020 up to 2050. The average capex value for 2015 was estimated from the GWI Desal Database.
  • Al Zahrani et al. [55] illustrate the energy consumption of SWRO plants with hydraulic turbines for seawater of different salinity levels. For 35 parts per million (ppm) salinity level, the energy consumption is approximately 3.1 kWh/m3. Assuming that the other processes such as seawater intake, pretreatment, post-treatment and brine discharge take 1 kWh/m3, the total energy consumption is 4.1 kWh/m3. This is in line with a presentation [56] on the desalination plants in Masdar, UAE, where energy consumption of SWRO plants is estimated at 4.5 kWh/m3. However, test plants built recently have an energy consumption of 3.3 kWh/m3. These low energy consumption trends are also observed in recently built large SWRO plants such as Ghlalilah, in the United Arab Emirates [57]. The total energy consumption of this plant is estimated to be just under 3 kWh/m3 [57]. However, the larger scale plants built recently use a pressure exchanger as the energy recovery device (ERD). For the purpose of our work, it is assumed that, after 2015, all SWRO plants will utilize pressure exchangers. According to Al Zahrani [55], the energy consumption with a pressure exchanger is about 2.6 kWh/m3. Thus, by 2020, it is assumed that the total energy consumption of the plants will drop to 3.6 kWh/m3. This is feasible as there are currently large scale plants with similar or lower energy consumption values. Meanwhile, Elimelech et al. [58] present the optimal energy consumption of the SWRO plants from 1970–2008. It is shown that the decrease in energy consumption between 2004 and 2008 is 5%. From 2020 onwards, there is assumed to be about a 5% decrease in energy consumption every 5 years. Elimelech et al. [58] explain that the practical minimum energy consumption of a SWRO plant with a 50% recovery rate and seawater salinity of 35 ppm, is 1.56 kWh/m3. Assuming 1 kWh/m3 for the other processes, the total minimum energy consumption is about 2.56 kWh/m3. Thus, by 2050, a total energy consumption of 2.6 kWh/m3 is assumed.

2.4.2. MED

  • Reddy et al. [59] and Al-Mutaz et al. [60] discuss the advantages of MED with thermal vapor compression (TVC) over MED without vapor compression. For our model, it was assumed that the MED plants installed are MED-TVC plants due to the lower thermal energy consumption and the recent growth in MED-TVC installations. A report by Fichtner explains that MED-TVC plants are approximately 25% higher in capex than SWRO plants [36]. Thus, for every time period, the capex of MED-TVC was assumed to be 25% more than the corresponding SWRO capex. Moser et al. [61] explain that operating costs of MED-TVC are usually 3–3.3% of the capex. For our study, the opex was taken to be 3.3% of the capex.
  • The average Gain Output Ratio (GOR) of MED-TVC plants in 2015 was obtained from the GWI Desal database [47]. Fath et al. illustrate how the GOR of MED plants will improve in the coming decades [62]. Palenzuela et al. [63] explain that the GOR of MED-TVC plants are generally 20% higher than MED plants. Thus, for this work, the GOR numbers presented by Fath et al. were increased by 20%. From 2040 to 2050 there is assumed to be no increase in the GOR.
The thermal energy consumption in kWh/m3 is determined from the corresponding GOR. The electrical energy consumption is assumed to be 1.5 kWh/m3 for all the years as found in Fath et al. [62].

2.4.3. MSF

  • The MSF capex number for 2015 is obtained as an average of all MSF plants built in 2015 [47]. The general value of the GOR is about 8 for MSF plants located in Saudi Arabia, based on the GWI Desal Database.
  • It is assumed that all cogeneration plants in KSA are a combination of a MSF desalination plant and OCGT—unfired with Heat Recovery Generator System (HRGS) [37].
  • The power-to-water ratio (PWR) is specific for cogeneration plants and indicate the amount of power produced per m3 of water produced a day. For MSF plants with an OCGT power plant and HRGS, this is about 2.25 kW/(m3∙d) [37]. The profits gained through the electricity produced by the cogeneration plants are used to offset the input gas costs. This applies to both the MSF and MED cogeneration plants.
The water production cost presented in this research takes into account the water transportation costs. In [24], we determined the 2030 desalination demand for the whole world on a 0.45° × 0.45° spatial resolution. In addition, we found the optimized vertical and horizontal water transportation distances for every desalination demand node. The optimized horizontal distance is the shortest distance from the desalination demand node to the coast line. The vertical height is the elevation between the desalination demand node and the optimized location on the coast line. The same procedure was used to determine the desalination demand as well as optimized horizontal and vertical transportation distances, for every 5 year time step from 2015 to 2050, for Saudi Arabia.
For the current transition study we used the total desalination demand for every 5 year time step and the corresponding weighted average horizontal and vertical transportation distance. Table 9 illustrates the optimized horizontal and vertical distances for Saudi Arabia.

2.5. Synthetic Natural Gas Production—Technical and Financial Assumptions

Figure 6 illustrates the expected growth in non-energy industrial gas demand in Saudi Arabia [64]. In our model the aim is to ensure that by 2050, the non-energy industrial gas demand is met from renewable energy. In 2015, the industrial gas demand is met with fossil natural gas. However, over time, PtG plants produce the SNG required. The increase in cost of fossil natural gas over time and the decrease in cost of PtG plants, makes it viable to produce SNG.

3. Results

The following two scenarios are simulated by the model:
1. Non-integrated scenario
In this scenario, the model determines the optimal transition pathway for Saudi Arabia’s power sector, discussed in Section 2.3, and the power plant capacities required for seawater desalination demand, discussed in Section 2.4. The gas sector is integrated with the power sector throughout from 2015 to 2050. Thus, the sum of the power plant capacities required for the three sectors present the total power capacities required to meet KSA’s power, water and gas demands in the energy transition.
2. Integrated scenario
In this scenario, the seawater desalination demand and the gas demand are integrated into Saudi Arabia’s power sector, throughout the transition from the fossil-based power system in 2015 up to a 100% renewable energy-based system in 2050. The desalination plants, integrated into the power system, will allow for the optimal use of the hourly energy produced by the renewable energy power plants. The excess energy produced by the renewable energy power plants can be stored as desalinated water and, at times of low energy production, the stored water can be used. Thus, the desalination plants offer additional flexibility to the energy system.
The model determines the power capacities required for the integrated scenario and the two scenarios are compared to understand the impacts of the integrated desalination plants. The integration of the gas sector with the power sector in both scenarios, enables to identify the integration benefits, if any, of the desalination plants only.
In the following sections, the technical and financial results of the energy transition for the integrated scenario are presented. The financial results are ultimately compared with that of the non-integrated scenario to learn the impacts of integrated seawater desalination plants.

3.1. Integrated Scenario—Power Sector

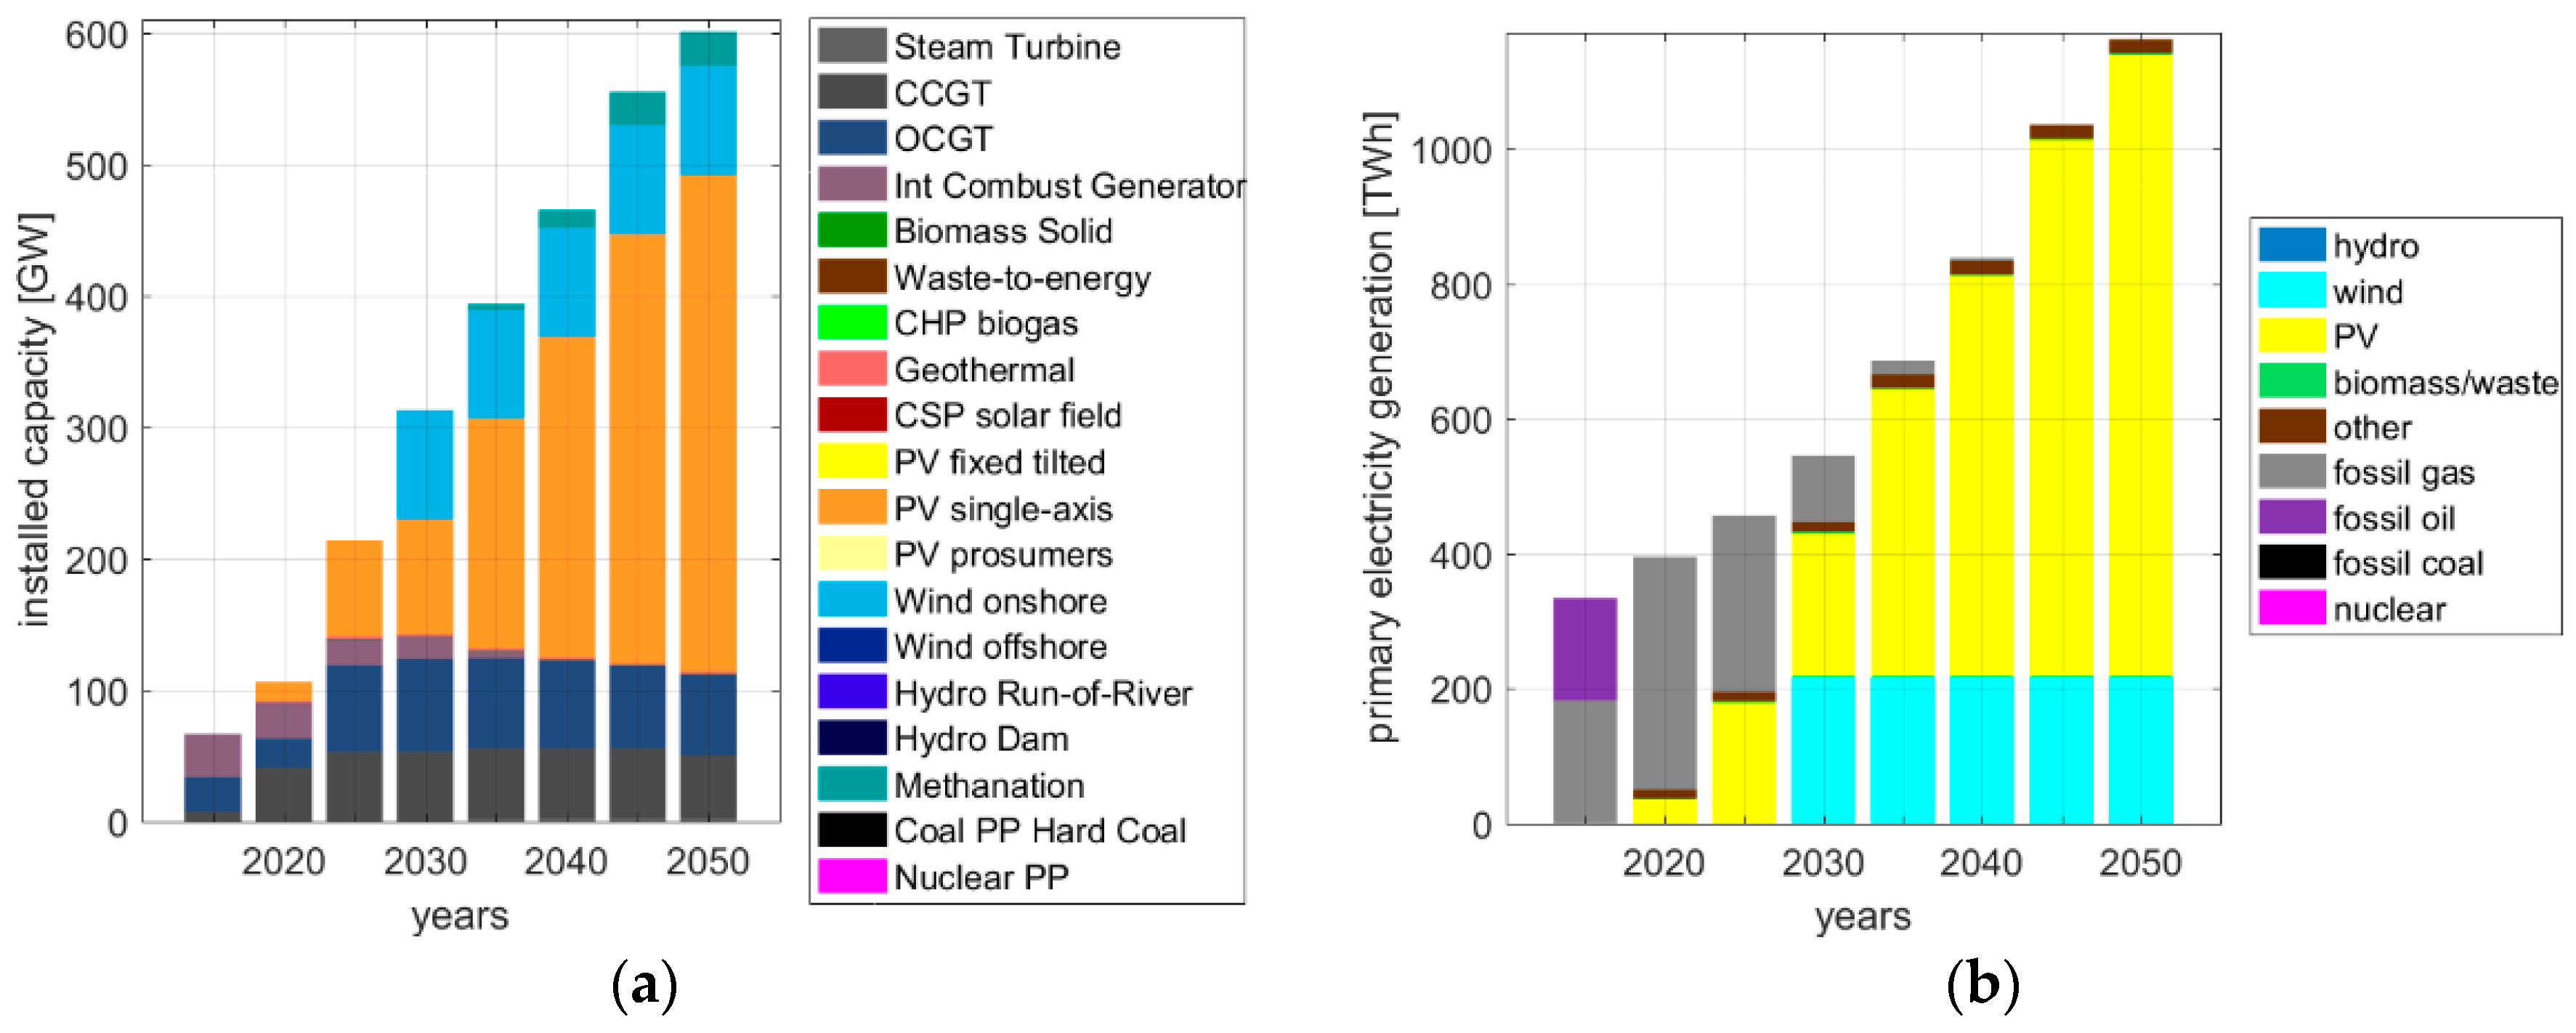
Figure 7a presents the installed capacities of the different types of power plants required for the energy transition from 2015 up to 2050. The colors from top to bottom in the legend are shown from bottom to top in the figure. In 2015, the total power capacity was 66.4 GW, out of which 32.9 GW were internal combustion engines and 33 GW were gas turbines. The model is restricted from installing more fossil fuels thermal power plants after 2015 and can only install renewable technologies to meet the growing electricity demand. However, power-to-gas-based gas turbines are not restricted. Internal combustion generators are eliminated from the system by 2040 after exceeding their technical lifetime. Thermal power plants running on natural gas are also eliminated from the system by 2040. Power-to-gas-based electrolyser and methanation plants are used to produce synthetic natural gas (SNG) that is then used as fuel for existing open cycle gas turbines (OCGT) or combine cycle gas turbines (CCGT). The total capacity of all plants required by 2050 is about 600 GW. PV single-axis tracking accounts for 377 GW and wind power plants account for 83 GW of the 600 GW required by 2050. Figure 7b presents the electricity production of the different power plant categories. After 2030, electricity production from wind power plants remain constant at 217 TWh. The installed capacities of PV single-axis tracking continue to grow and start to dominate the Saudi power sector. By 2050, PV single-axis tacking contributes 922 TWh out of the total annual electricity generation of 1163 TWh, representing 79%. CSP plants for electricity generation are added from 2030 onwards but, by 2050, only account for 0.6% of the total electricity generation share. This is attributed to the higher costs of CSP for electricity generation compared to solar PV, based on the technical and financial assumptions in Appendix A (Table A1). Figure 7b also illustrates the diminishing use of fossil oil and gas in the energy system. The power capacities required for the energy transition can be found in the Appendix A (Table A4).
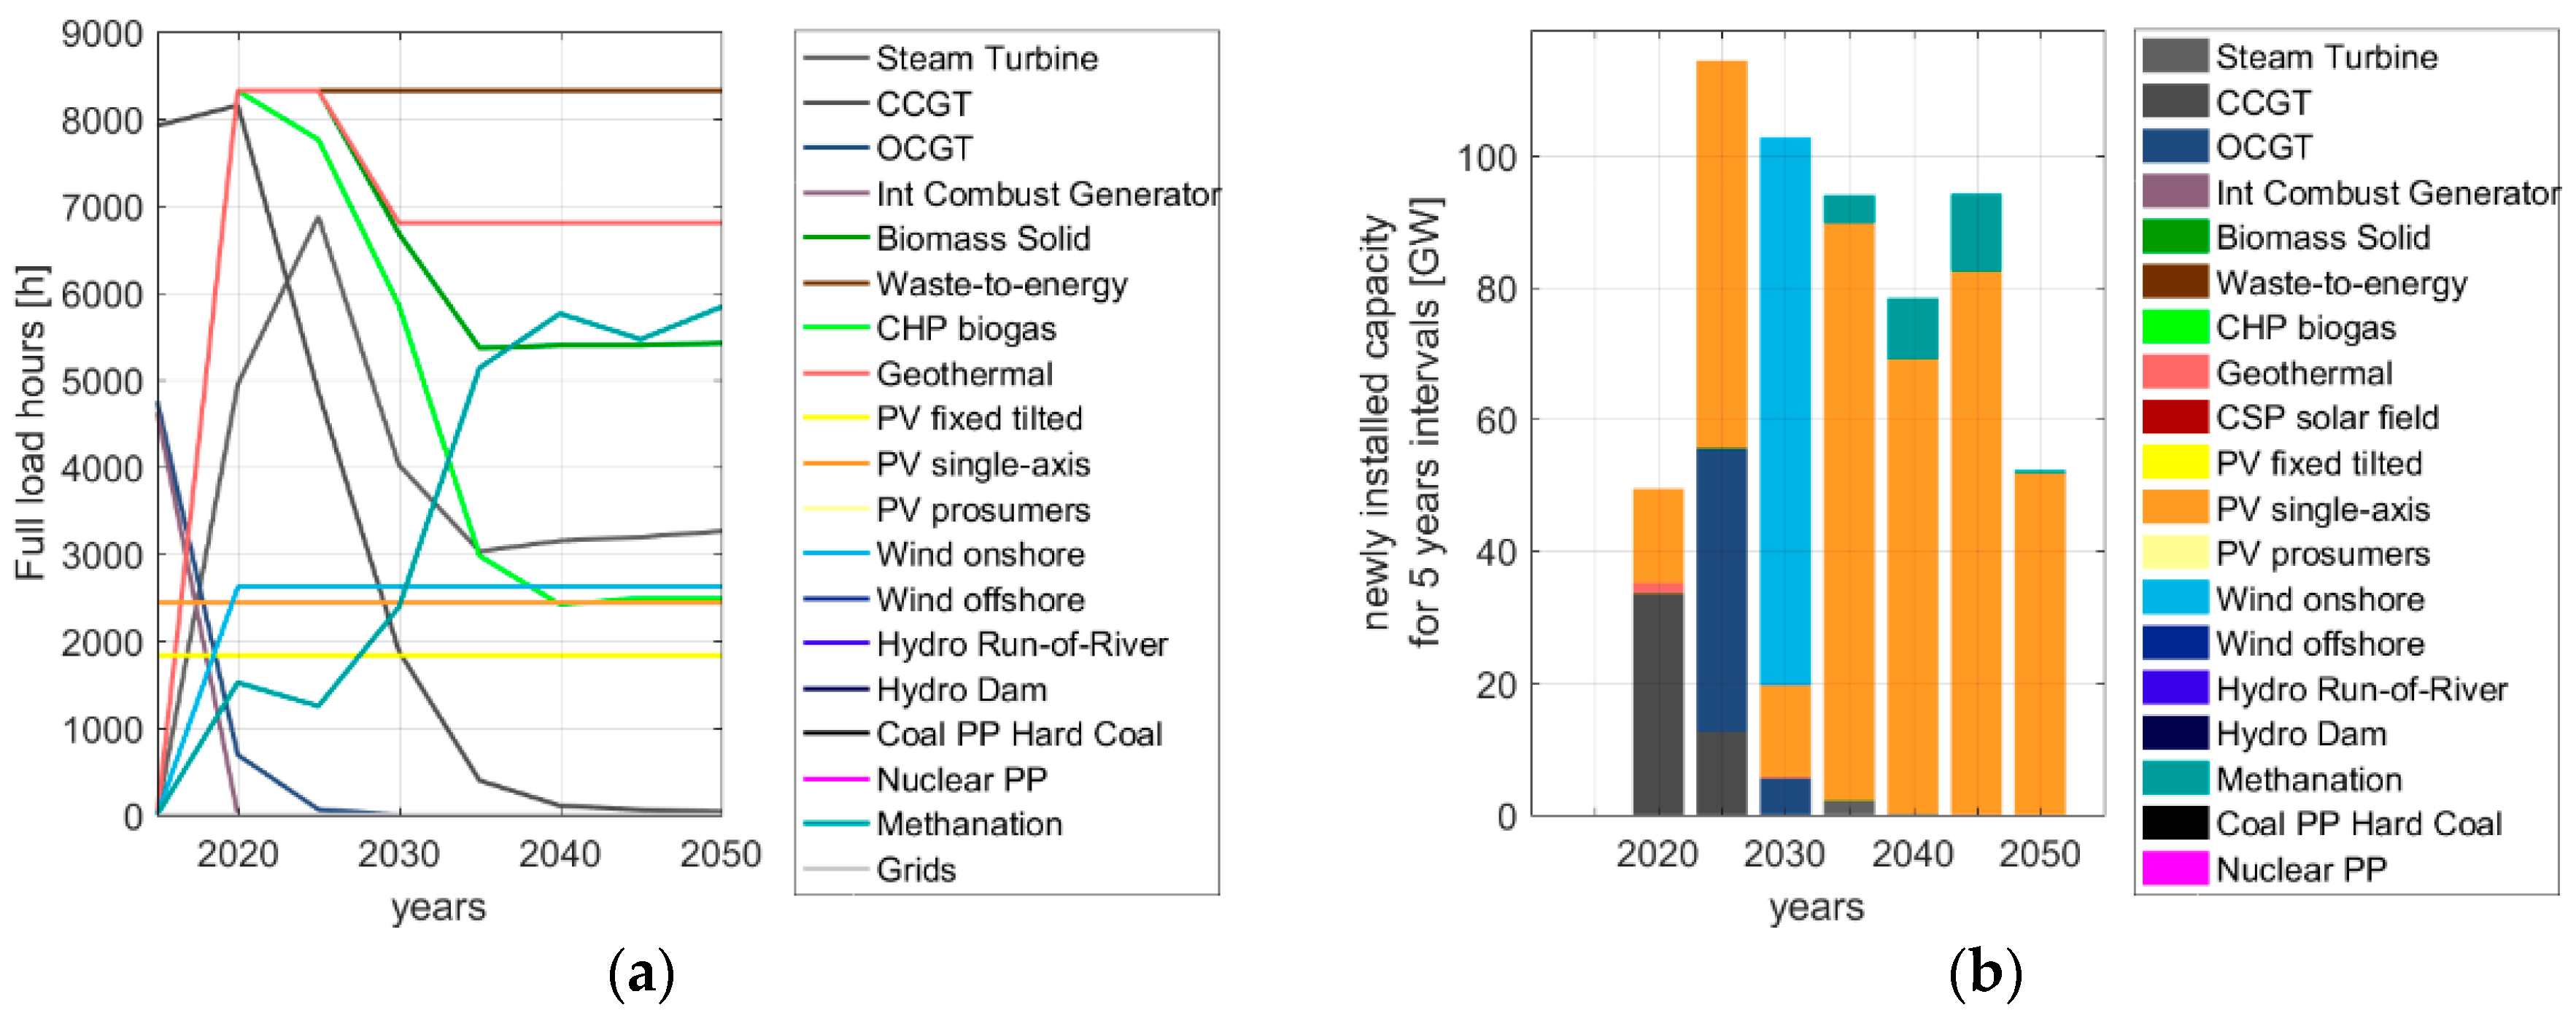
Figure 8a illustrates the full load hours (FLH) of the different power plants utilized by the model. The FLH of PV single-axis tracking, PV fixed tilted and wind onshore plants are constant at 2443, 1830 and 2618 h. The model determines the optimal FLH and the capacities of the power plants. The FLH of the internal combustion generator rapidly diminishes from 4625 to almost none by 2020. The high cost of oil renders the existing oil powered thermal power plants too expensive to run, since world market prices are taken into account to avoid subsidies for the energy system. In addition, the FLH of the OCGT reduces from 4756 FLH to zero FLH by 2030. The lower cost of the natural gas, in contrast to oil, still enables natural gas powered CCGT plants to be cost effective. However, after 2040, as shown in Figure 7b, there is no more contribution from natural gas powered thermal plants. The remaining CCGT plants are used with SNG to store and produce electricity as required in the Saudi power system.
Figure 8b represents the additional capacities of different power plants necessary to meet the growing electricity demand and to replace the fossil-based thermal power plants that are being phased out. Initially, there are more wind power plant installations than PV power plants. However, after 2030, the installation of wind power plants cease and PV single-axis tracking start to dominate the power sector. Methanation units are added for the first time in 2035, with additional capacities added until 2050, to meet the gas demands of the energy system and industrial gas demand through SNG.
Figure 9a represents the additionally installed storage capacities for every 5 years period. The large capacity of gas storage is required in 2045, and thereafter, less additional storage is required. Figure 9b represents the ratio of the total storage output for every time period. By 2025, electricity storage systems come into effect as it becomes a more cost effective option to balance the power system than the use of fossil powered thermal plants. By 2050, batteries provide a total output of about 413 TWhel which accounts for about 41% of the total electricity demand and about 58% of the direct electricity supply.
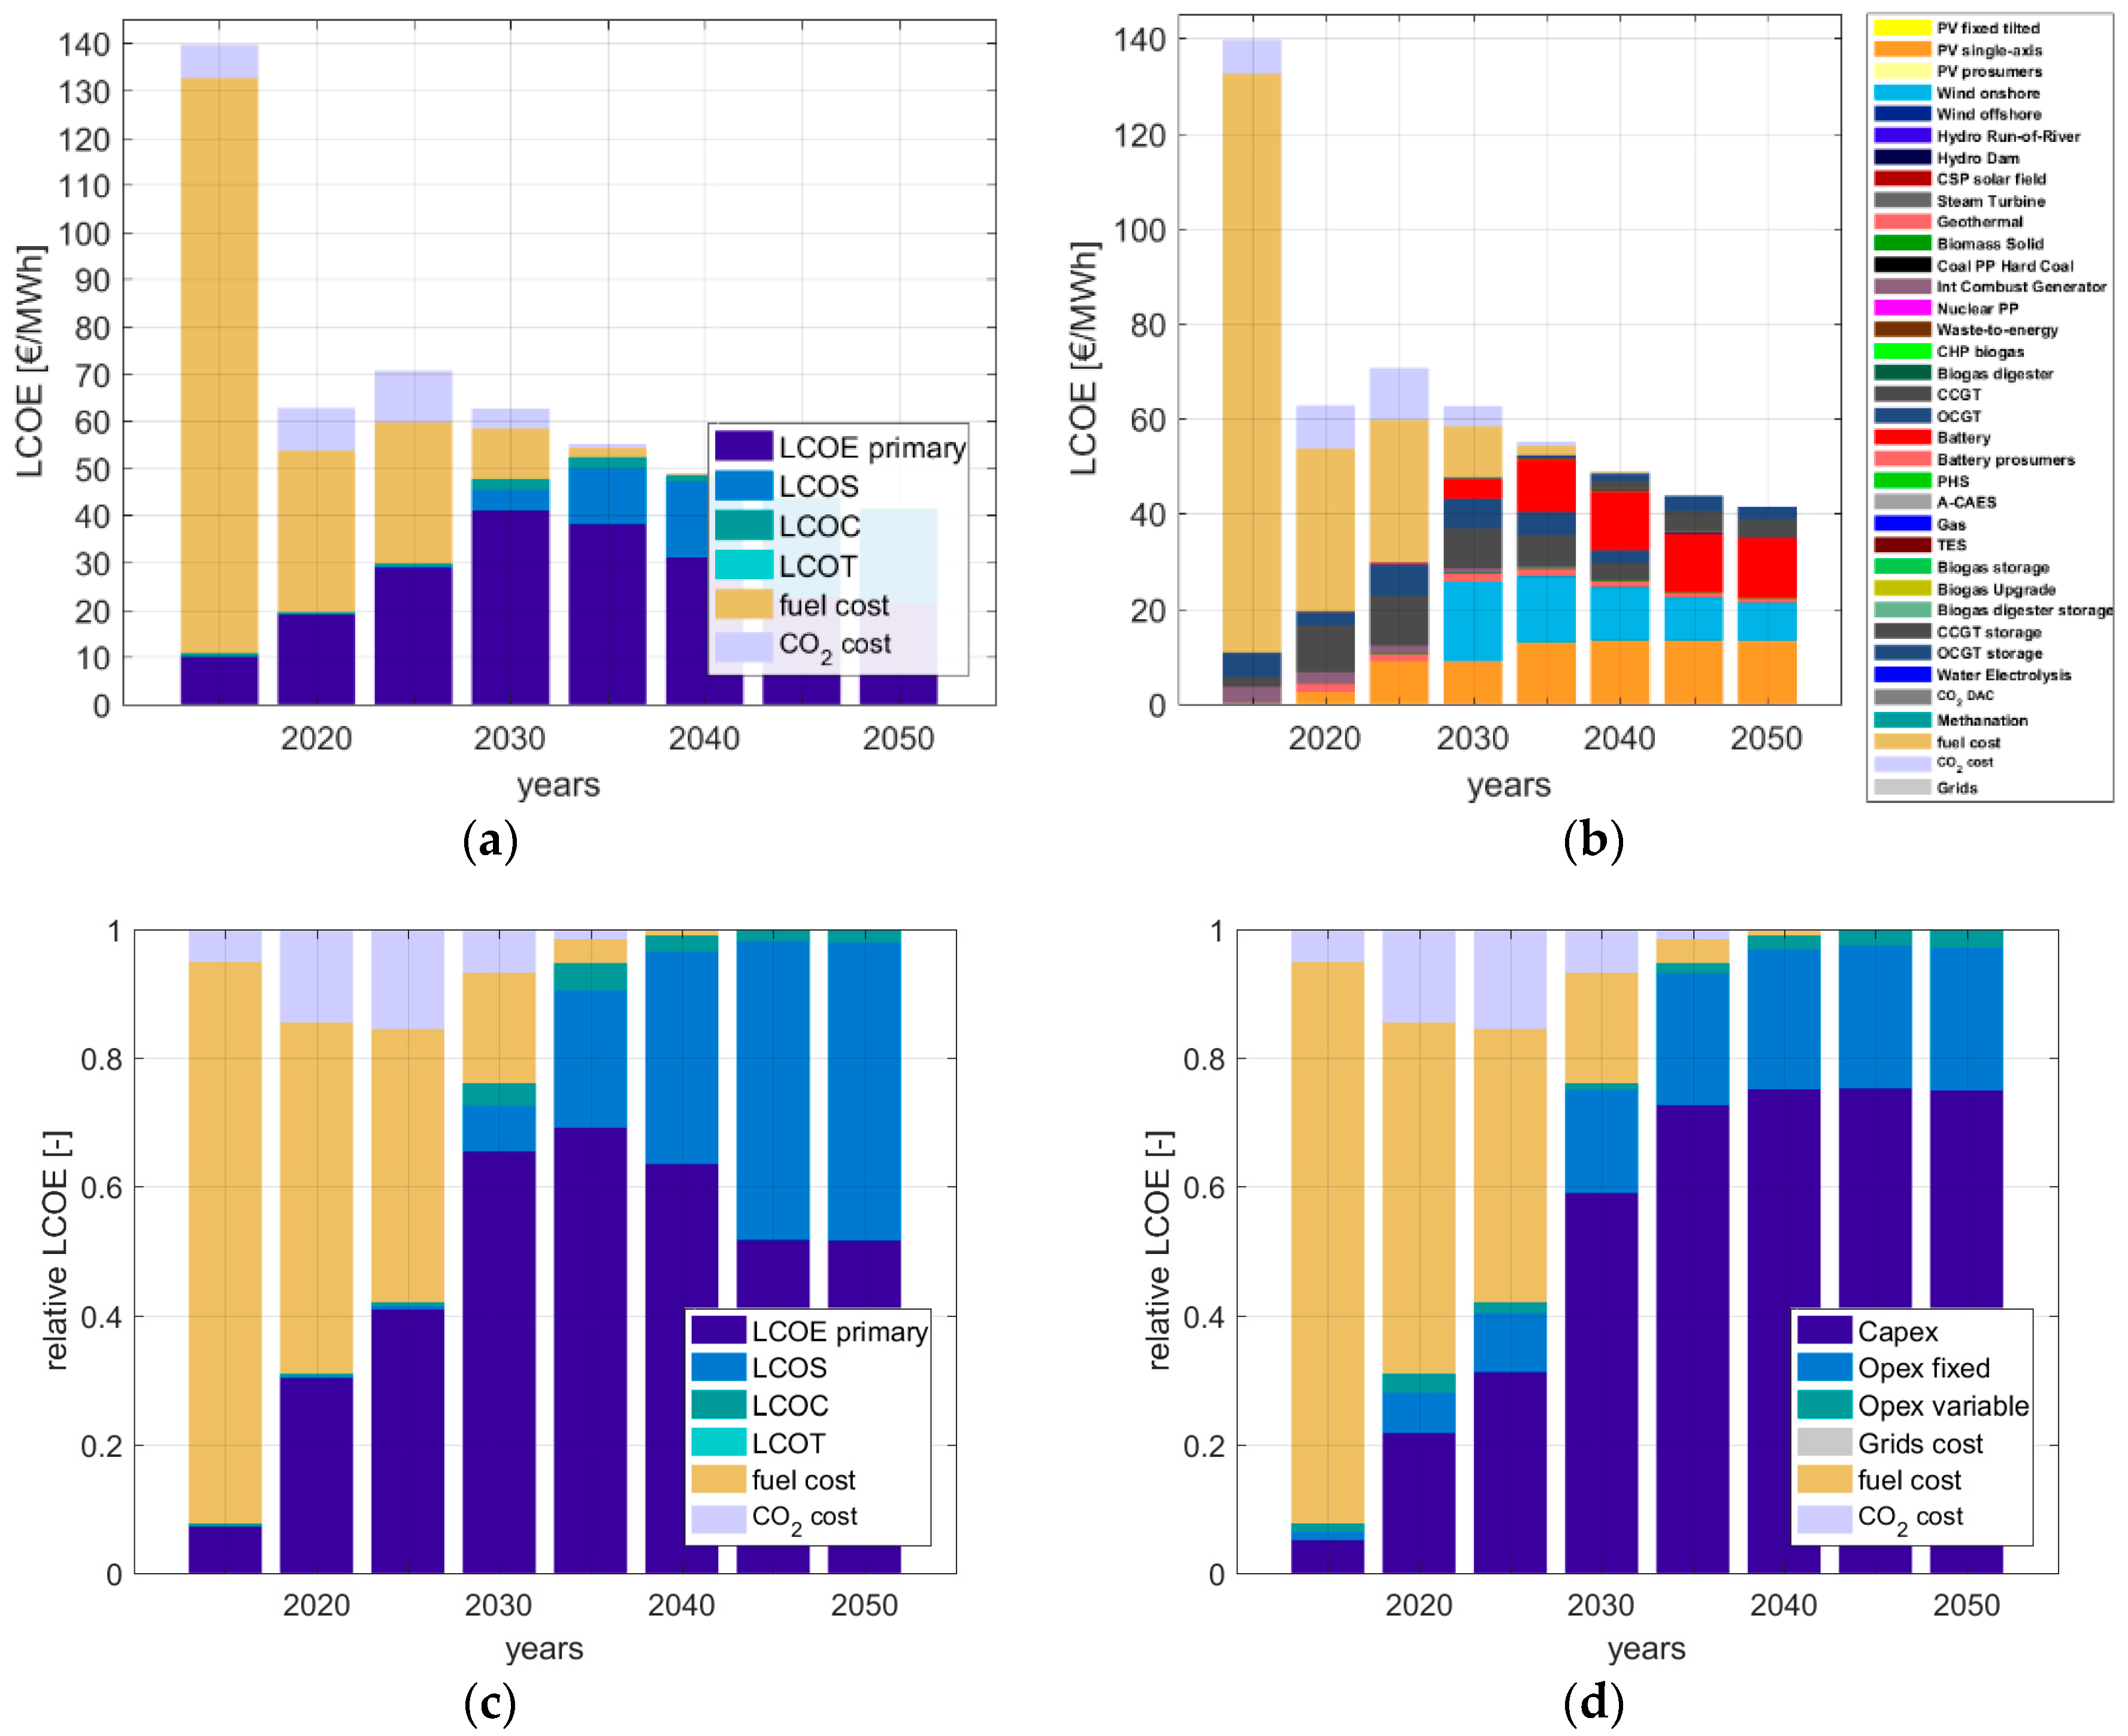
The total levelised cost of electricity of the system is the sum of the levelised cost of primary electricty generation (LCOE primary), levelised cost of storage (LCOS), levelised cost of curtailment (LCOC), fuel cost and the carbondioxide emission cost (CO2 cost). Figure 10a represents the contribution of the different components to the total LCOE from 2015 to 2050. In 2015, the fuel cost accounts for the largest contribution due to the fuel prices of 52.50 €/MWhth for oil and 21.8 €/MWhth for gas. As the FLH of the fossil powered thermal plants decrease, as illustrated in Figure 8a, the fossil fuel consumption and consequently the contribution to the LCOE decreases. The OCGT storage and CCGT storage plants in Figure 8a refer to the gas plants utilising SNG.
The LCOC is as a result of curtailment of the excess energy produced by the renewable energy power plants. The remaining thermal power plants contribute to the CO2 emissions cost. The batteries and gas storage contribute to the LCOS of the power system. The figure illustrates that with the transition to renewable power plants and the phasing out of the thermal powered plants, the total LCOE of the system decreases. By 2050, the LCOE is estimated to be about 41 €/MWh as opposed to 139 €/MWh in 2015. Figure 10b separates the LCOE primary and LCOS to the individual components and presents the specific contributions towards the LCOE. The rapid drop in LCOE from 2015 to 2020 is due to the phasing out of unsubsidized expensive oil power plants. This eliminates the large fuel cost that contribute towards the LCOE cost in 2015, as shown in Figure 10a,b. In 2020, the oil power plants are substituted by more economical solar PV and gas plants. By 2050, the largest contributors to the cost will be the PV single-axis tracking and battery plants. The contribution of wind decreases after 2030, due to no more wind plant installations and a highly competitive combination of hybrid PV-battery plants, as already found by Afanasyeva et al. for the case of Morocco [65]. However, there is still a substantial contribution from wind to the LCOE in 2050 due to the large installed capacities of wind power plants in 2030.
Figure 10c presents the relative contribution of the different components to the LCOE. It can be seen that over time, the LCOE primary increasing accounts for the final LCOE. The relative contribution of the fossil fuel cost, and therefore also the CO2 emission costs, disappear. From 2030 onwards, the relative contribution of the storage increases and ultimately by 2050, the LCOS and LCOE primary have almost equal contributions to the LCOE. This is also reflected in Figure 10d. Figure 10c presents the relative contribution of the financial components to the LCOE. In 2015, the fossil fuel costs determine the LCOE. As the fossil fuel usage diminishes, the total capex of the power system is the largest relative contributor to the LCOE. From 2040 onwards, when there is a 100% renewable energy system, the capex of the system contributes up to 75% of the LCOE. The fixed opex of the energy system components mostly account for the remainder of the LCOE.
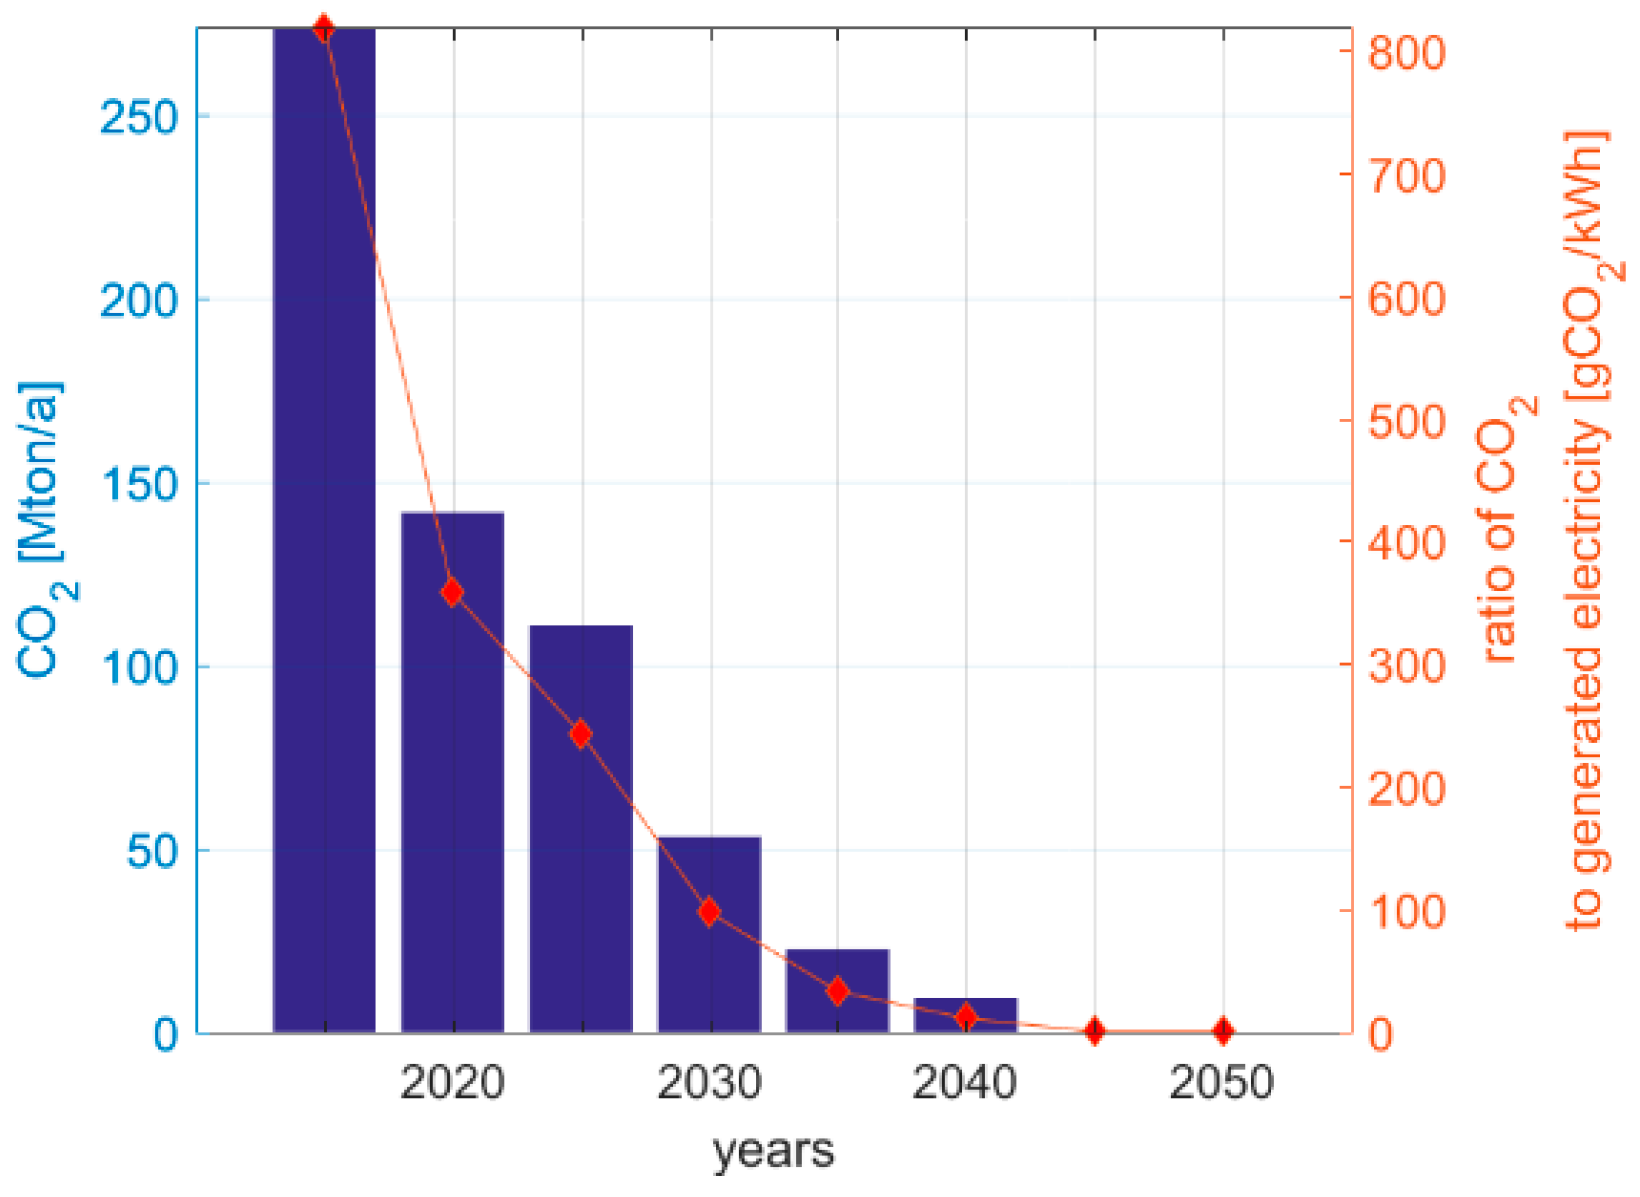
Figure 11 illustrates the annual CO2 emissions during the energy transition illustrated in the previous figures. The annual CO2 emissions are reduced from about 250 Mton/a to 0 by 2040. The red line diagram represents the ratio of CO2 emitted for every kWh of electricity produced. In 2015, this value is at about 800 g of CO2 per kWh and drops to 0 by 2040. The CO2 emission calculations are explained in [65].
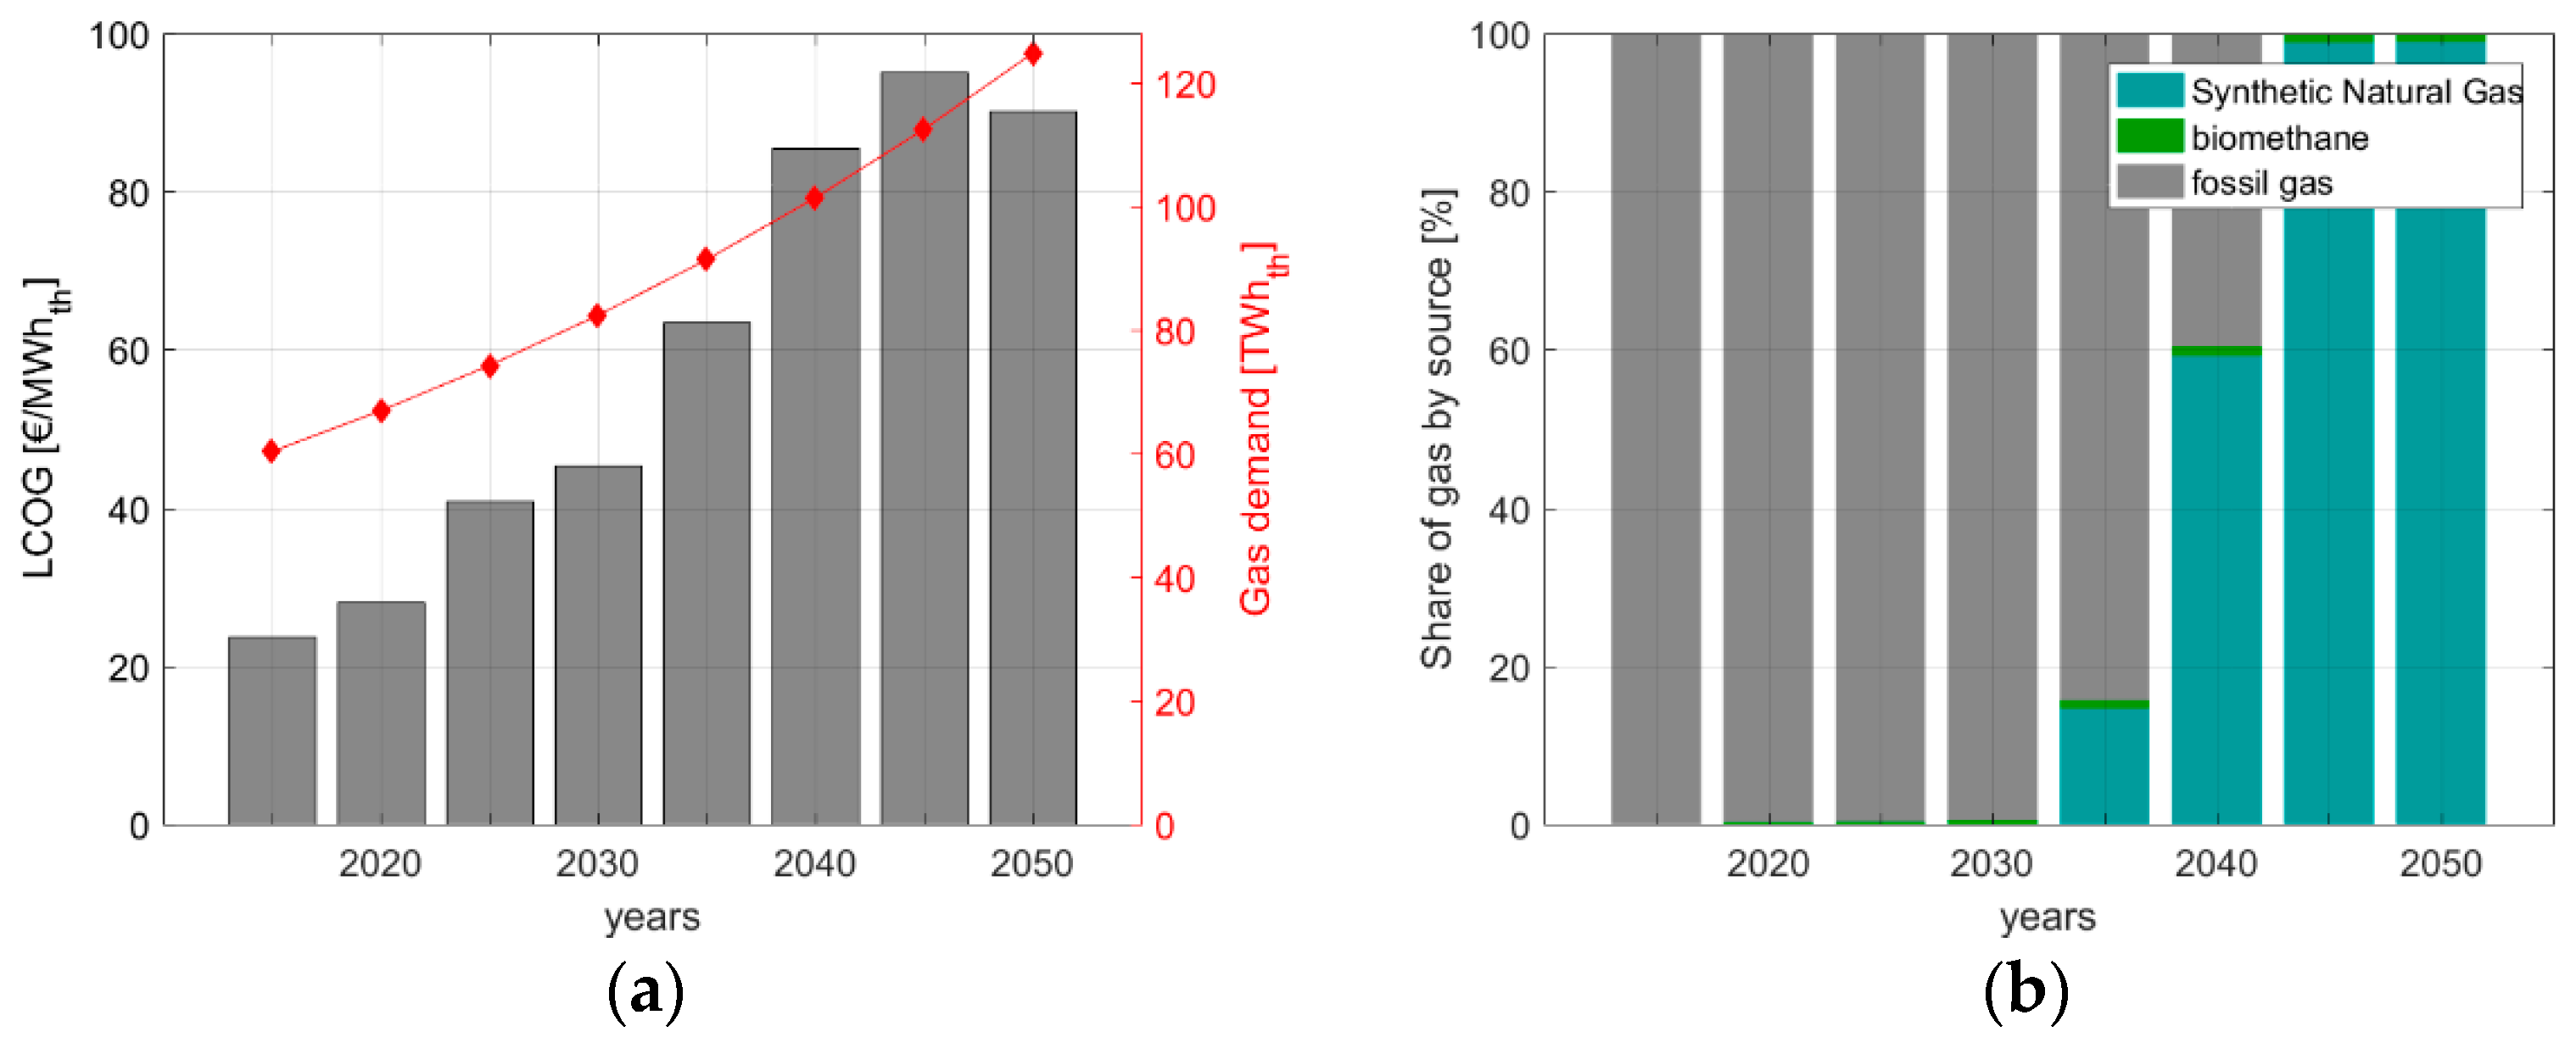
Figure 12 provides an overview of the gas sector after integration with the power sector. 
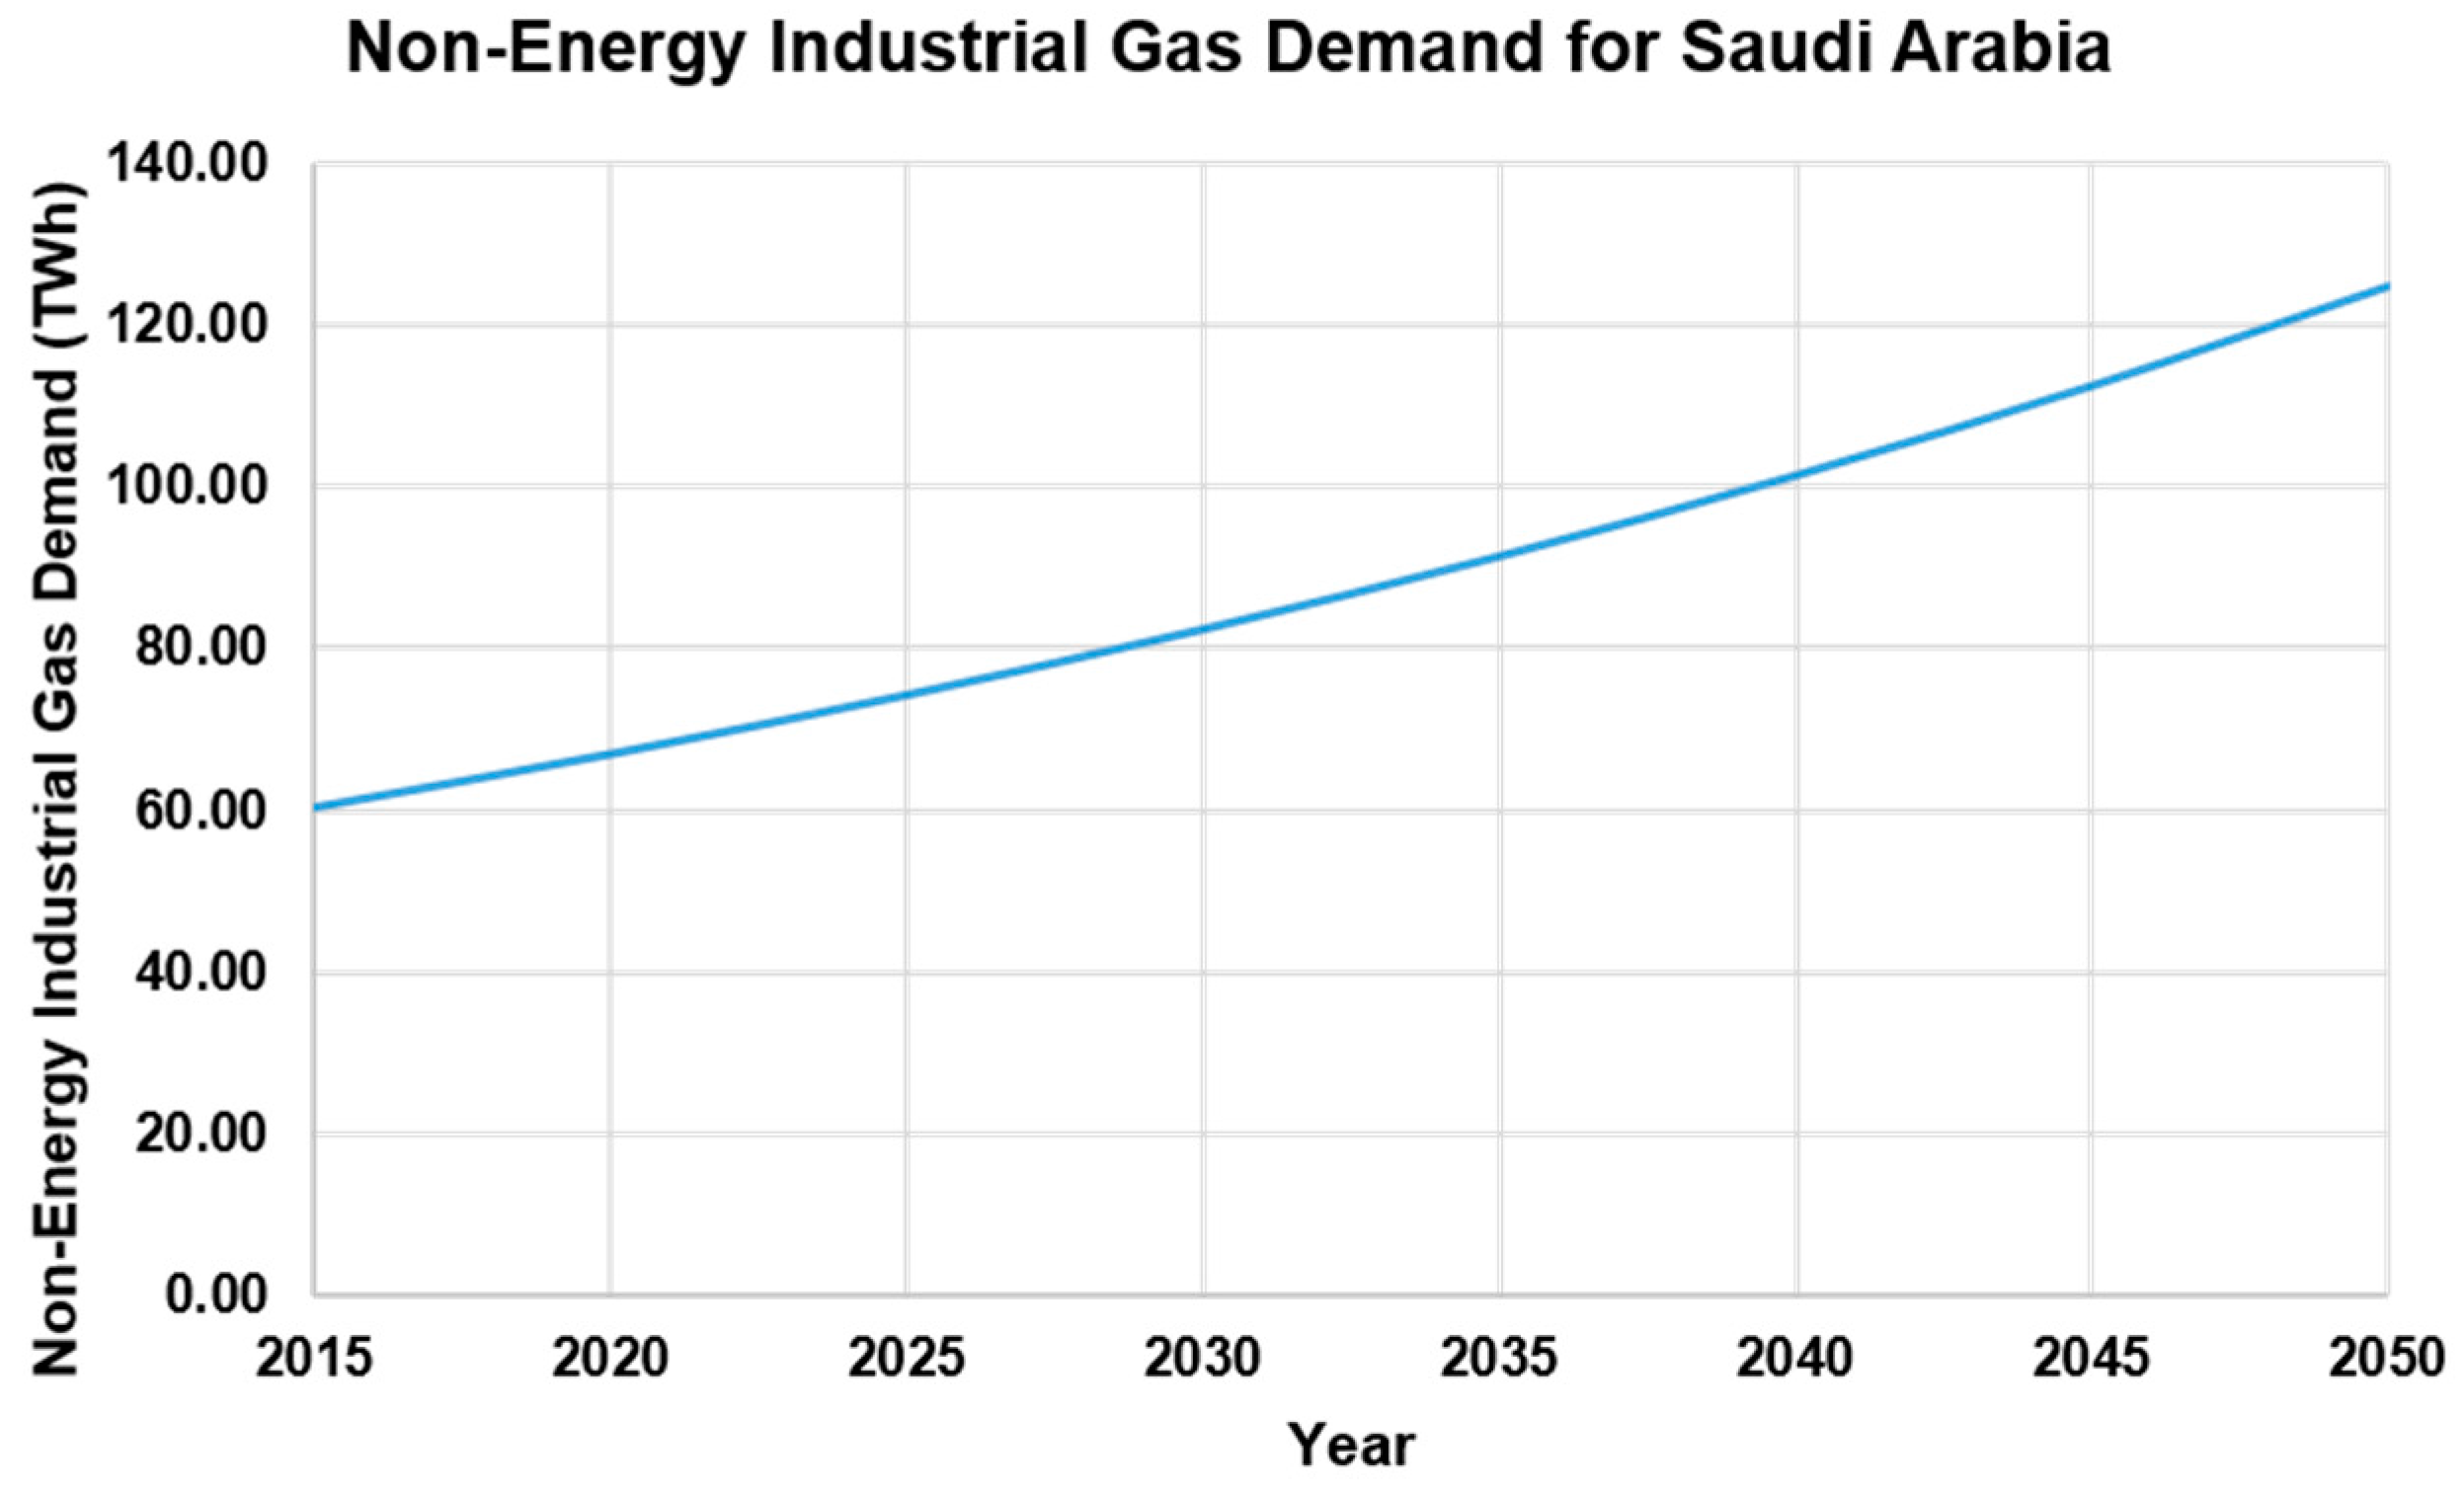
Figure 12a shows how the levelised cost of gas (LCOG) varies over time, while the non-energetic industrial gas demand increases. The LCOG increases from 23 €/MWhth in 2015 to 95 €/MWhth in 2045. After 2045, the LCOG decreases and by 2050, the LCOG is 90 €/MWhth. There is a steep increase in the LCOG from 2030 to 2035. This due to the production of SNG in 2035, as shown by Figure 12b. By 2040, the gas utilized in the system is fully renewable SNG.

3.2. Integrated Scenario—Desalination Sector

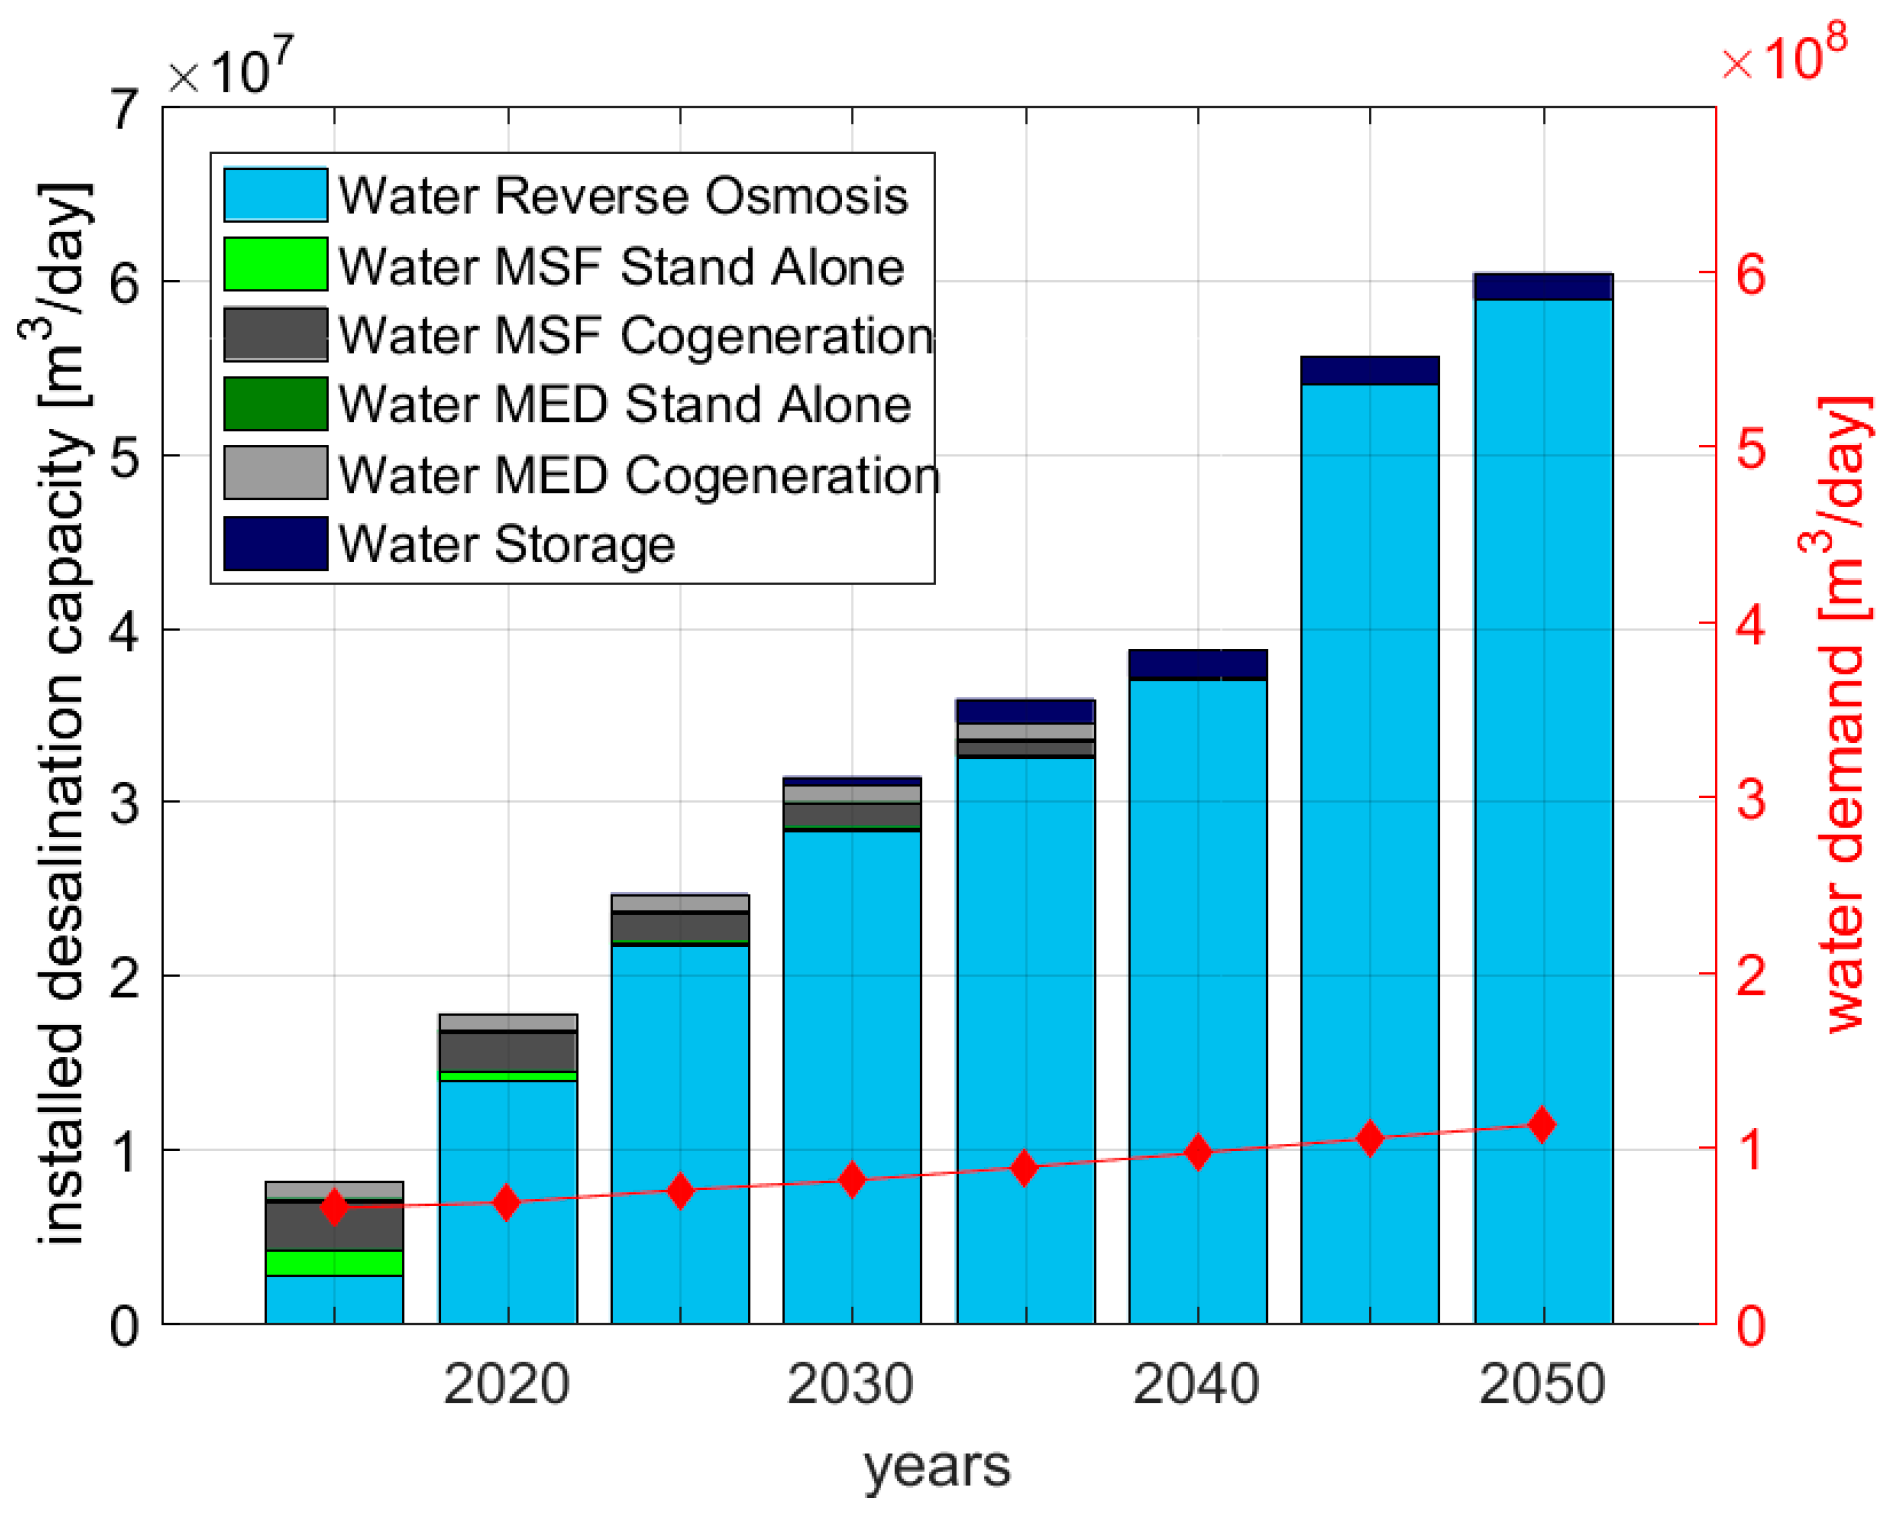
Figure 13 illustrates the growth of the Saudi Arabian desalination sector assumed in the model. The difference between the total water demand and the installed desalination capacity is met by renewable water sources and non-renewable groundwater sources. As explained in Section 2.4, the desalination demand increases to meet the growing total water demand and is met through SWRO and MED stand alone plants. The model optimizes the installed capacities of SWRO and MED depending on the electricity costs and availability of heat in the system.
The MSF and MED cogeneration plants are phased out based on the lifetime of the plants. By 2050, it is expected that there is a total water demand of 112 million m
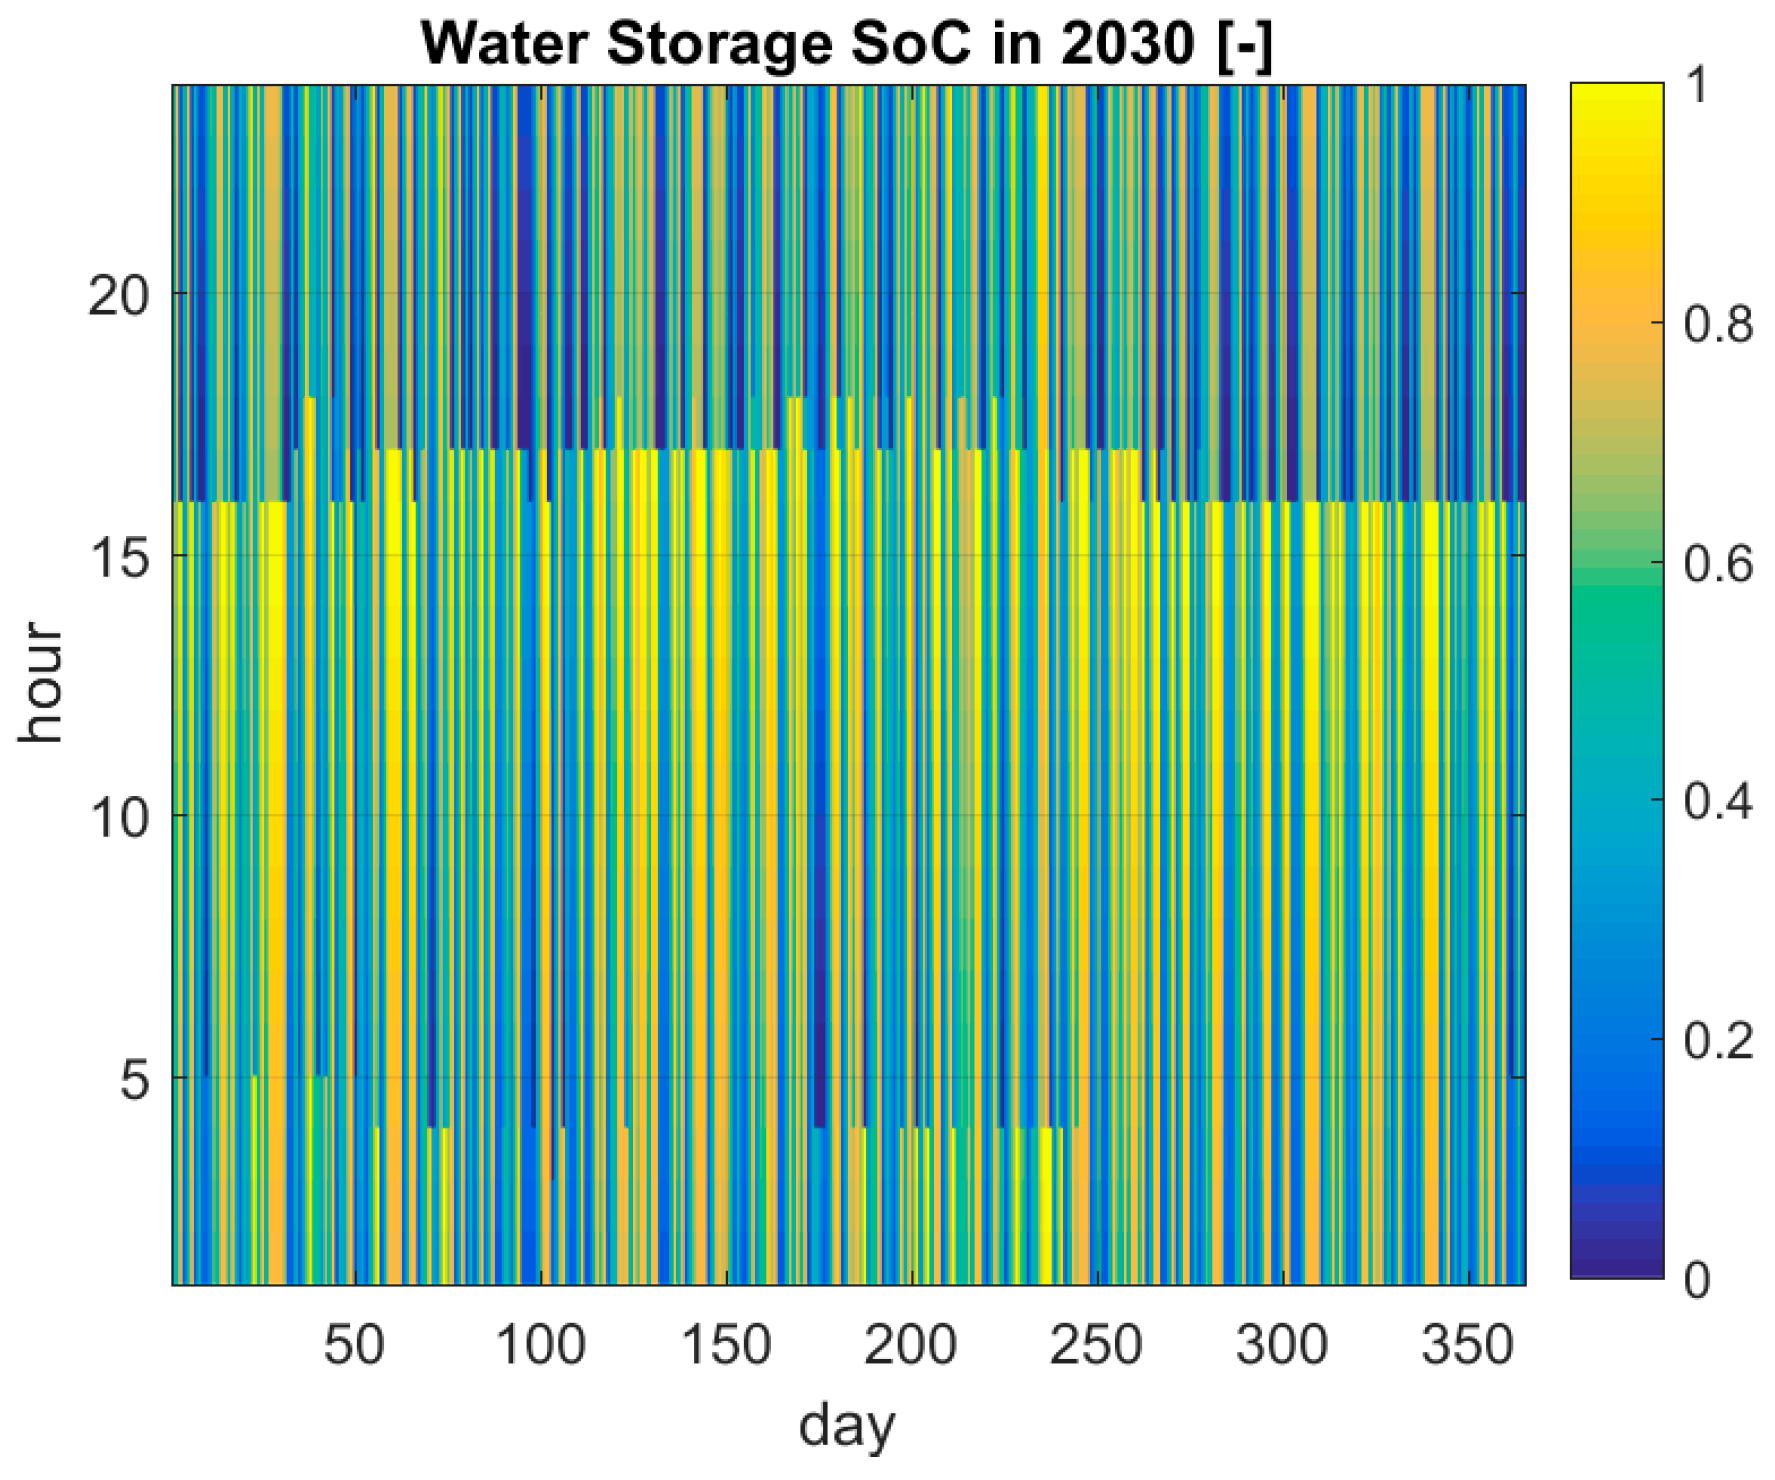
3/day and SWRO plants meet 52% of the total water demand. MED stand alone provides less than 1% of the total water demand. This is due to the lower excess heat available in the system. In addition, water storage is found to vary daily after 2020. Figure 14 illustrates the variation in water storage for the year 2030. Thus, the water storage acts a daily or seasonal storage optimizing the operation of the desalination plants. With the increase in SWRO desalination capacity there is an increase in water storage capacity.
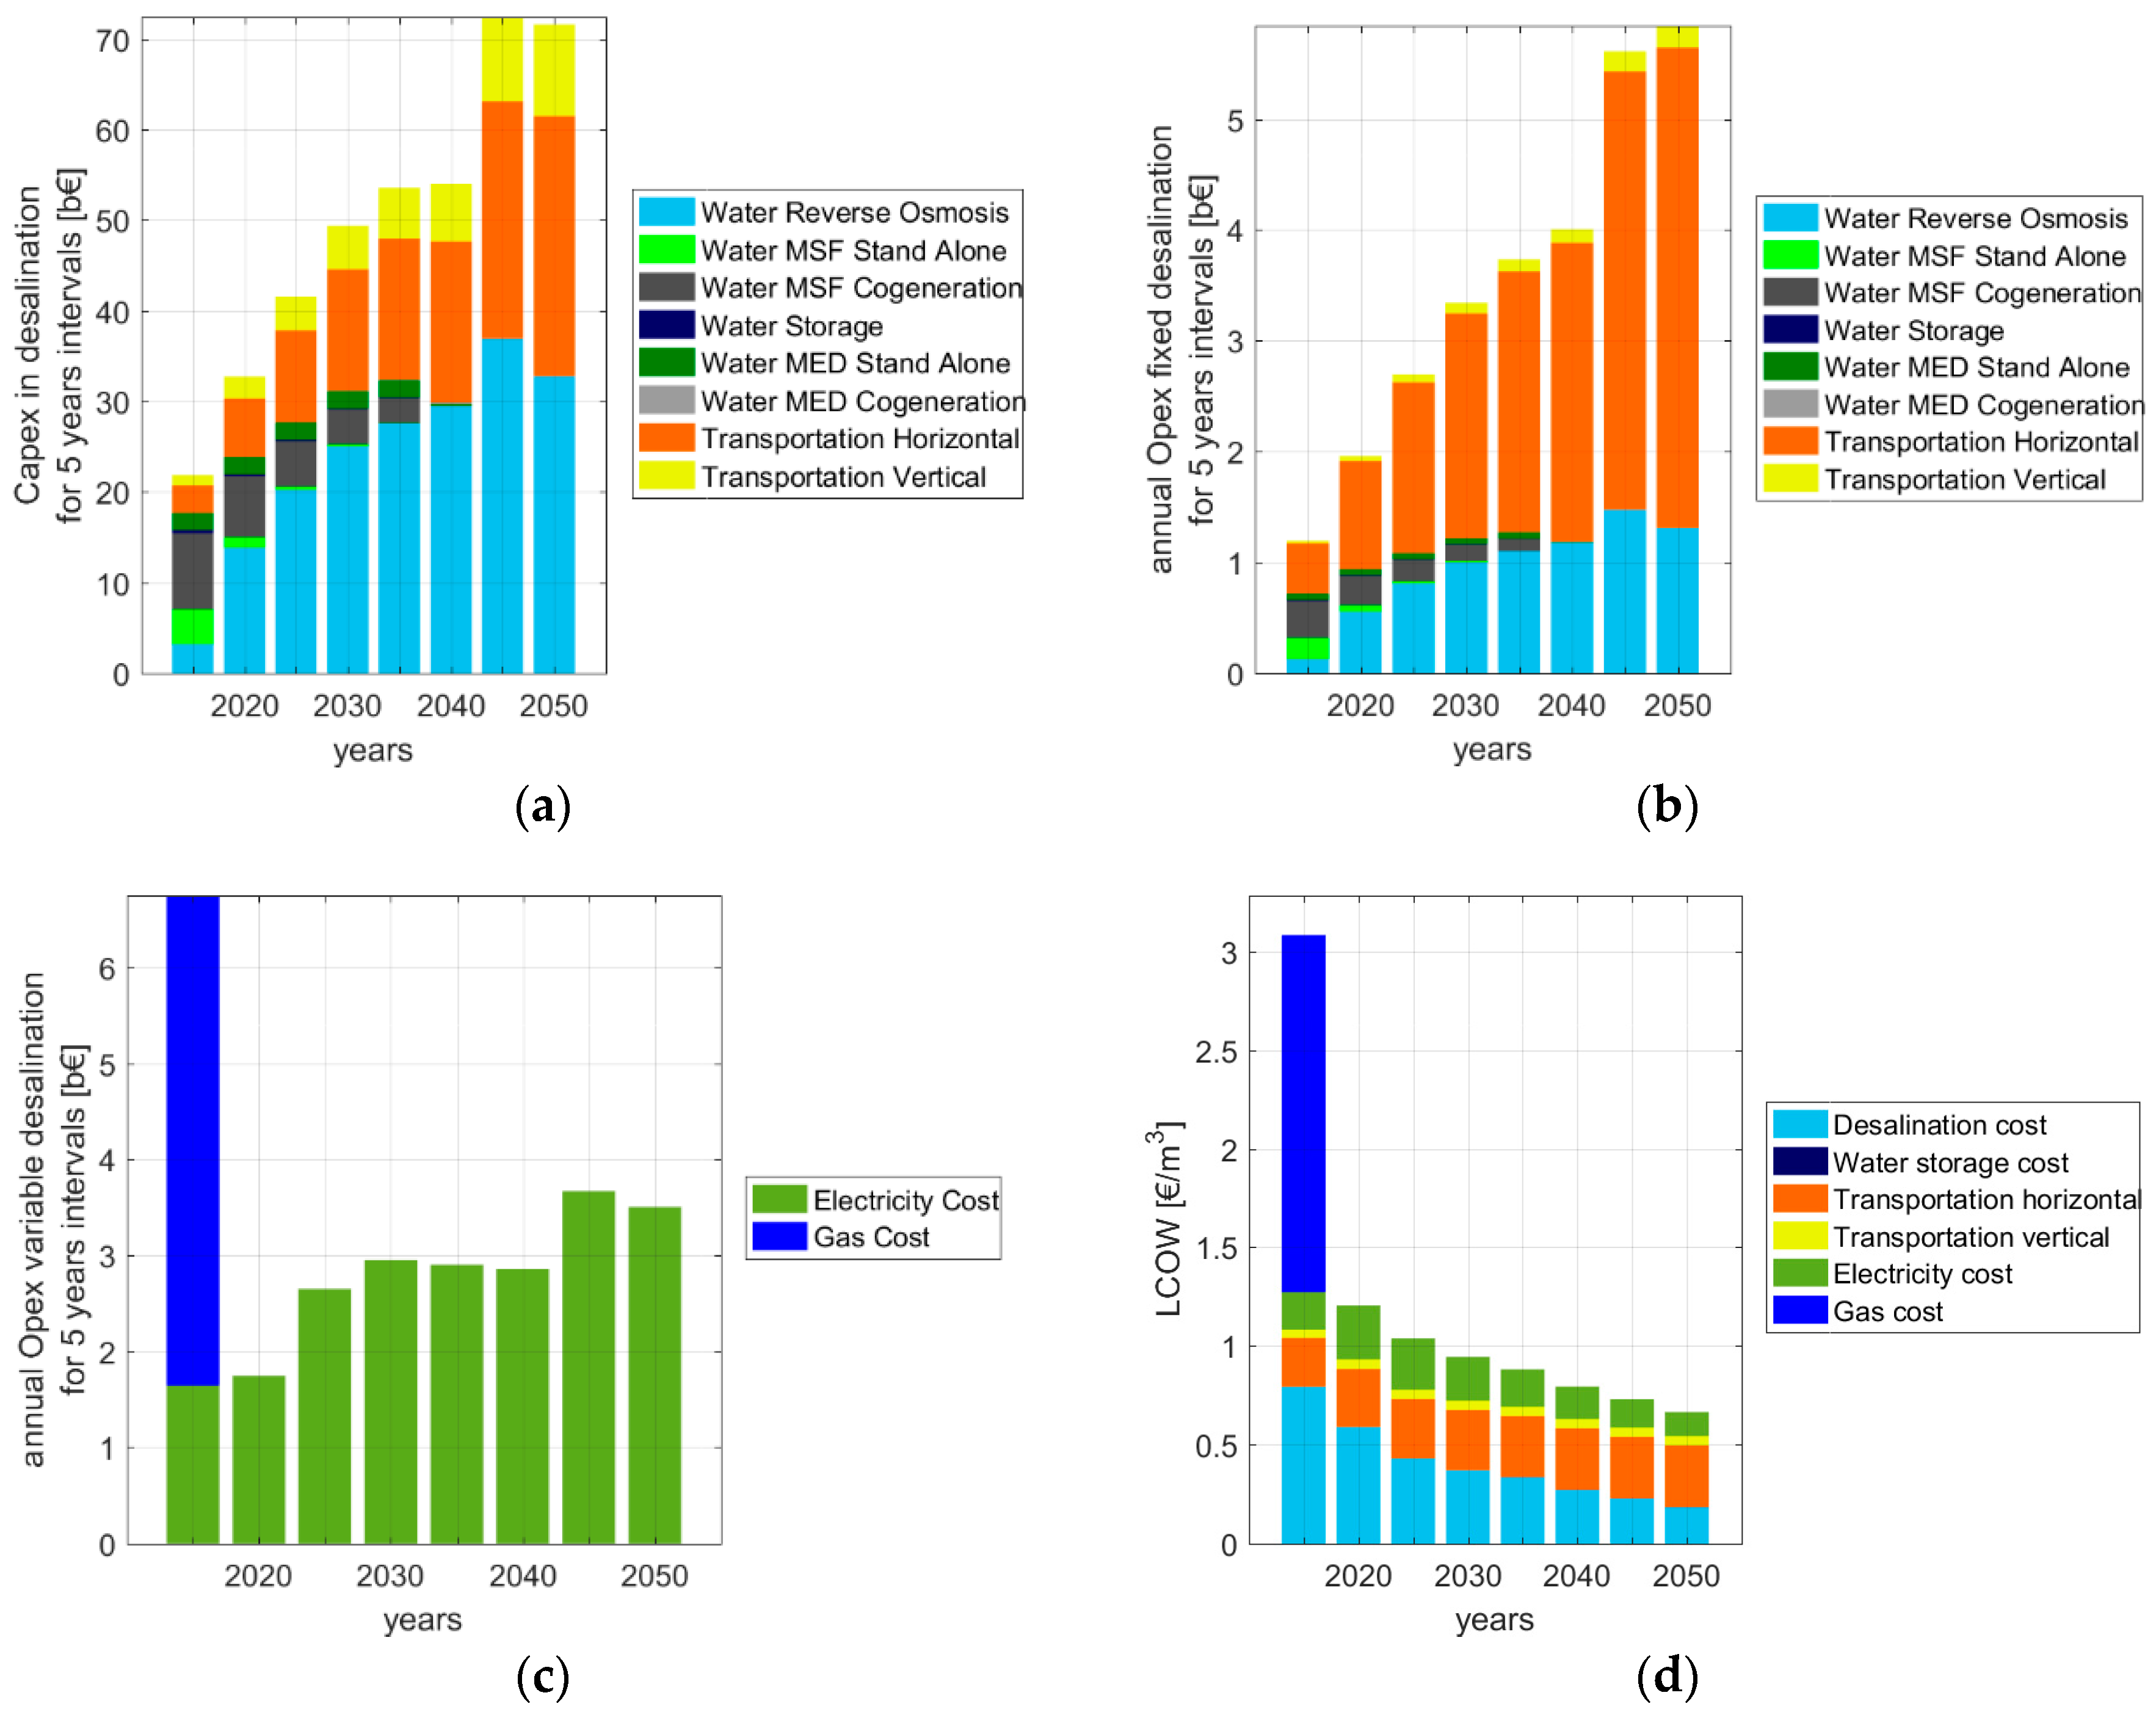
Figure 15a presents the capex breakdown of the desalination plant capacities installed for the 5 year intervals. The contribution of water transportation increases as the installed desalination capacities increase. By 2050, the transportation infrastructure is the largest contributor to the capex. The total capex required for the period from 2015 up to 2050 for the desalination sector is 1125 b€.
Figure 15b presents the variation in the annual fixed opex of the desalination capacities. With the increase in desalination capacities, the fixed opex increases. The fixed opex excludes the electricity consumption of the desalination plants and water transportation infrastructure. Figure 15c represents the variation in the annual variable opex. The annual variable opex accounts for both the gas and electricity consumption of the desalination plants. In 2015, due to the electricity produced by the cogeneration plants, there is no resulting electricity costs—the variable cost is finally the gas cost. The increase in the electricity cost maybe explained by the considerable increase in installed SWRO capacities with time and the variation in energy efficiency of the plants. There is only a minimal gas cost for existing cogeneration plants. SWRO and MED stand-alone plants utilize electrical energy and heat from the energy system as required.
Finally, Figure 15d illustrates the contribution of the different aspects of the desalination system to the final LCOW for every time period. The LCOW of the final system decreases from 3.29 €/m3 in 2015, assuming non subsidized oil and gas prices, to 0.66 €/m3 in 2050. The costs reduction is mainly due to the elimination of gas consumption and decrease in electricity costs, but also in an increase in the efficiency of RO and MED desalination plants in the decades to come.
Table 10 shows the energy consumption of the different desalination technologies during the transition. The total electricity consumption of the SWRO plants increase due to the high installed capacities. The MSF and MED cogeneration plants only produce water up to 2030 and then are decommissioned due to end of lifetime. The MED stand alone plants continue to produce water but at lower volumes than in 2015. This is because of the low availability of heat in the energy system.
Table A4, in the Appendix, summarises the key power capacities determined for the energy transition pathway for KSA from 2015 to 2050.

3.3. Comparison of the Integrated and Non-Integrated Scenarios

As discussed in 
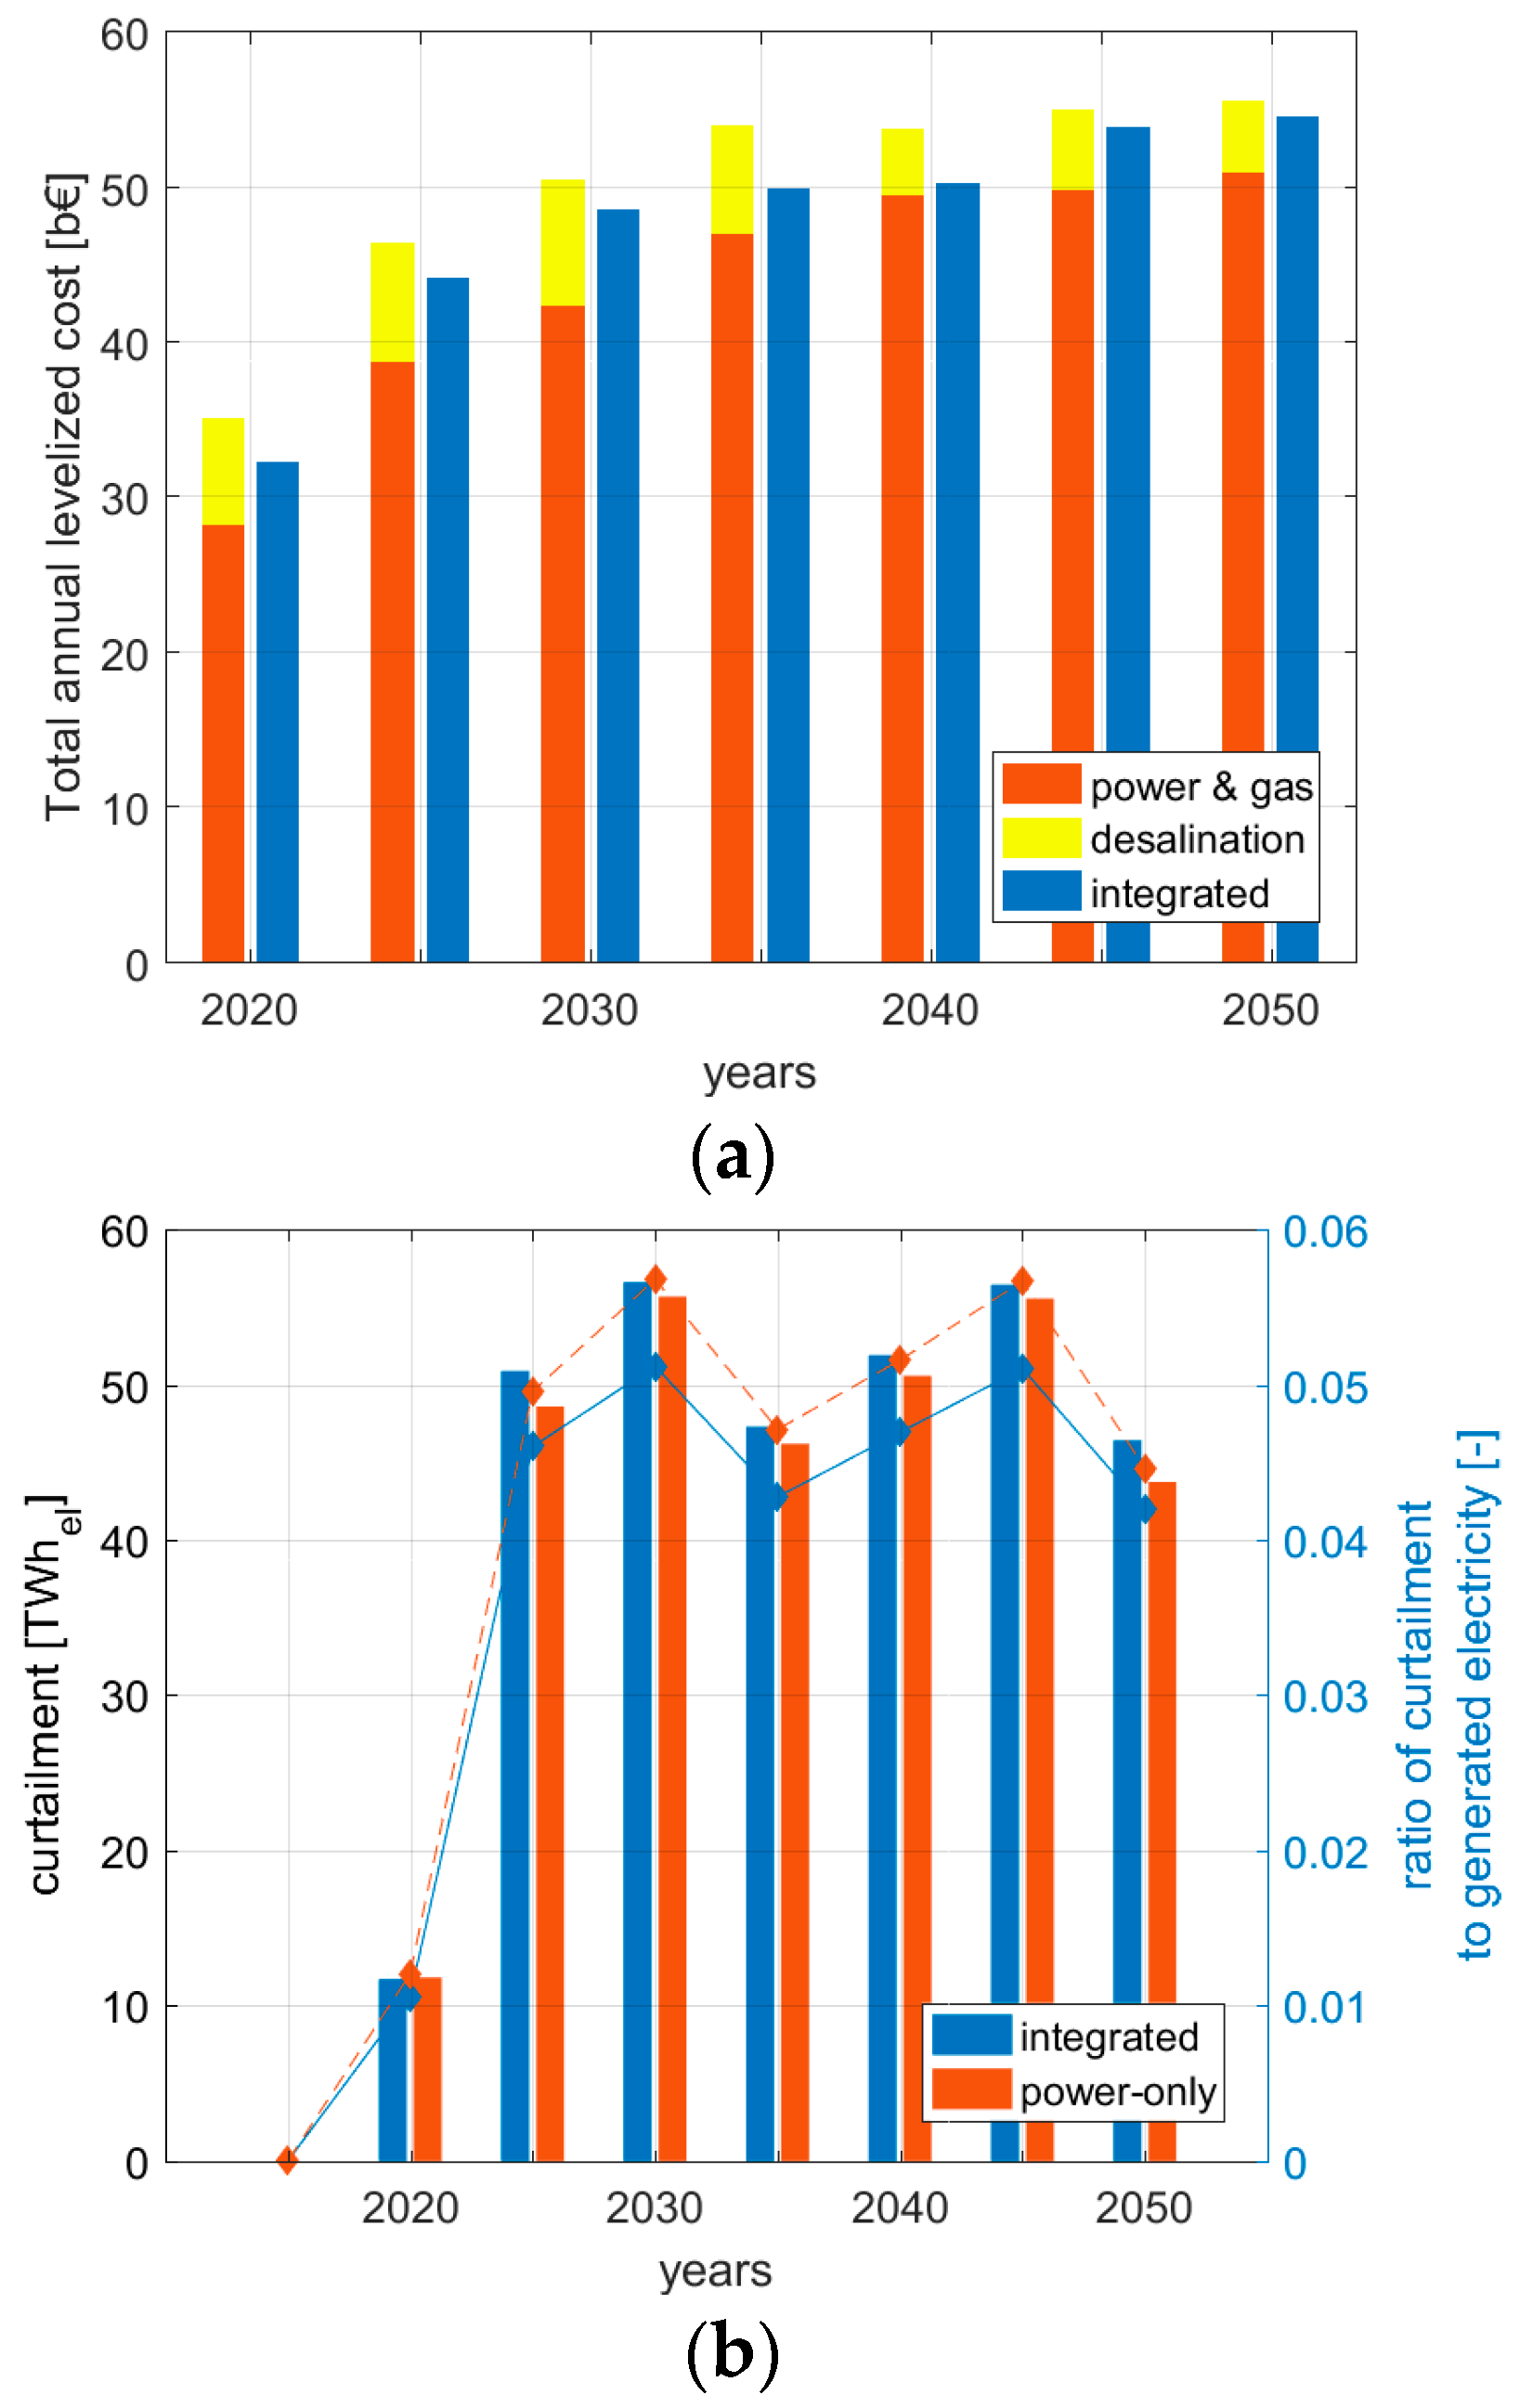
Section 3, the model was run for a non-integrated scenario where the power capacities to meet the electricity demand and the desalinated water sector are found separately. To compare the integrated and non-integrated scenarios, the annual levelised cost for both scenarios from 2020 to 2050 was found. This is represented in Figure 16a. The annual levelised cost for the non-integrated scenario is higher than that for the integrated scenario. It is found that the approximate percentage benefit of the integrated scenario is between 1% and 3%, as a consequence of increased flexibility to the integrated energy system.
Figure 16b illustrates the curtailment of electricity for the two scenarios, for the time period from 2015 to 2050. The bars represent the value of the energy curtailed and the dashed lines represent the ratio of the curtailed energy to the total generated electricity. It can be seen that there is more curtailed energy in the integrated scenario. However, the ratio of the curtailed energy to the total electricity generated is lower in the integrated scenario. This can be attributed to the increased flexibility provided by the desalination plants and therefore better utilization of the hourly produced renewable energy, hence the integrated energy system can be run in a more efficient way than the separated systems.
It has to be mentioned that in the integrated scenario, for the total time period of 2015 to 2050, the power-to-gas (PtG) electrolyser capacity is reduced by 1%, compared to the separated scenario. For the integrated scenario, the PtG electrolyser capacity was estimated to be 73.6 GWe, respectively. For the non-integrated scenario, the corresponding values was estimated to be 75.4 GWe.

4. Discussion

The results show how the integration of seawater desalination with power and gas sectors contribute to the least cost transition path to achieving a 100% renewable energy sector in Saudi Arabia before the proposed year 2050.
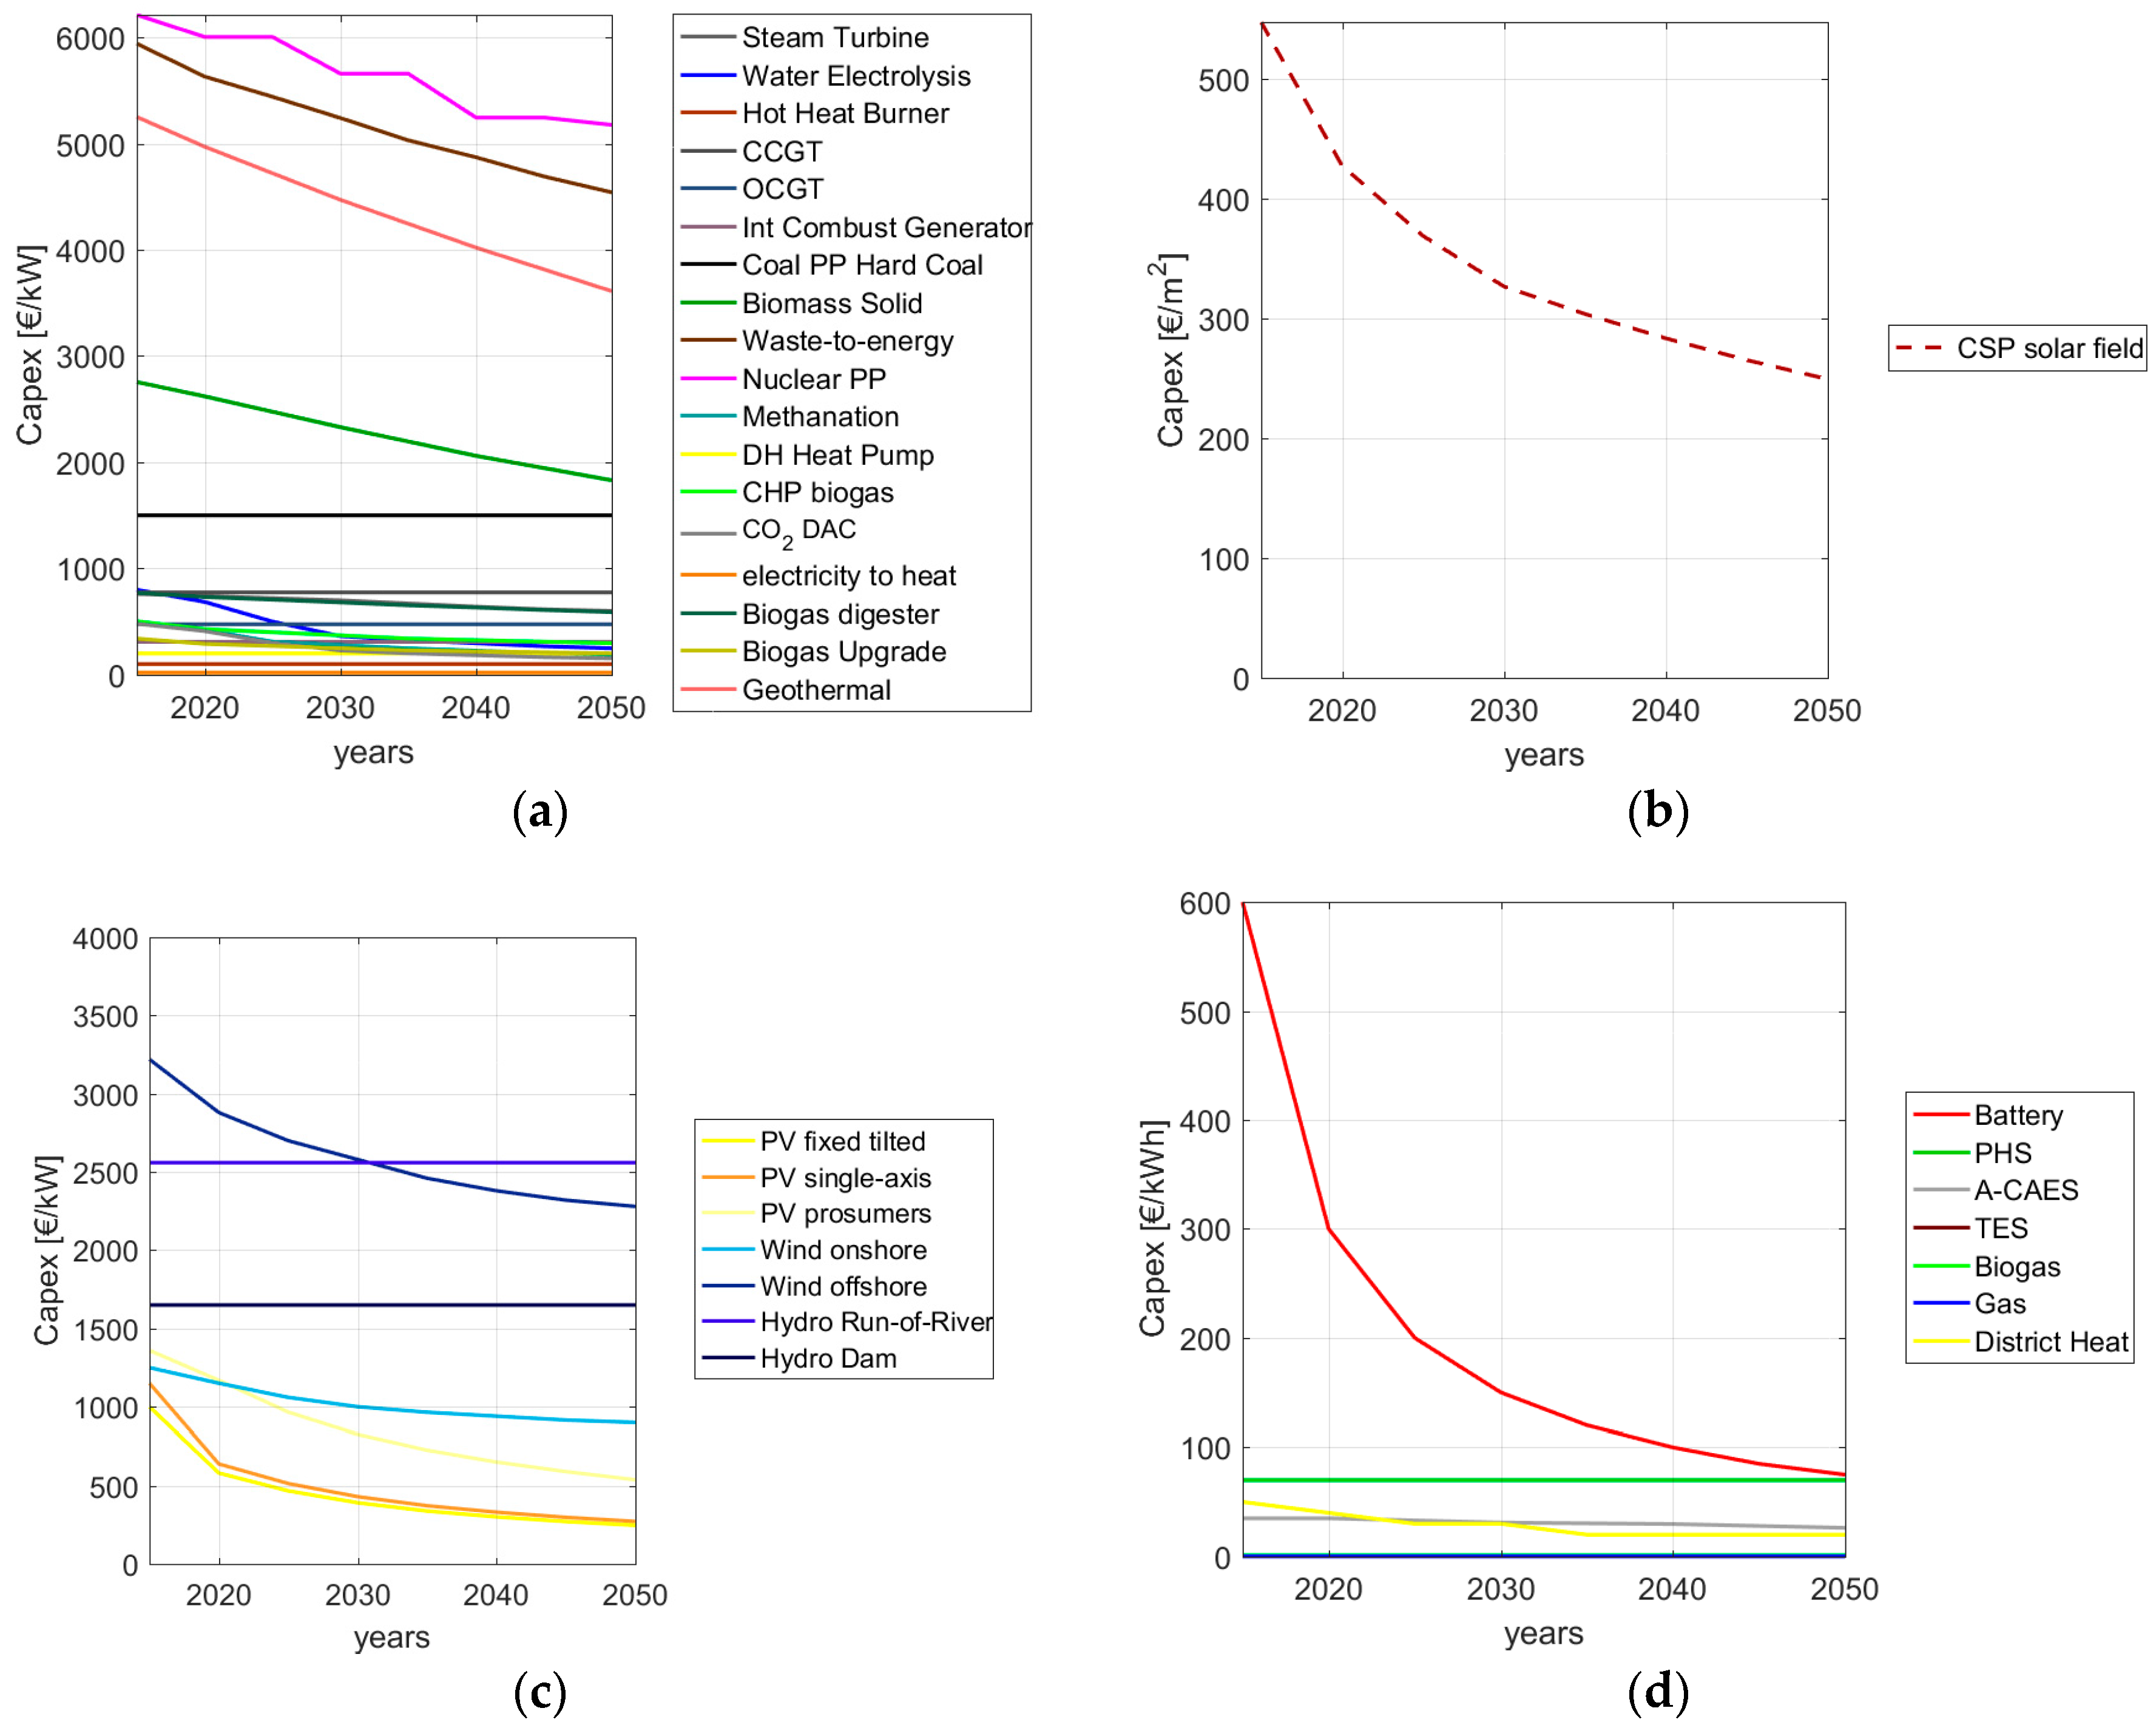
Figure 7b illustrates that this milestone is feasible for Saudi Arabia by 2040. By 2040, PV single-axis tracking and wind power plants will dominate the Saudi power sector with 243 GW of the former and 83 GW of the latter. However, by 2050, due to the steeper decrease in the PV single-axis tracking and battery capex than the wind onshore plants, as presented in Figure 4c, it is more economical to have PV single-axis tracking as the dominant energy source in the power sector of Saudi Arabia. By 2050, about 377 GW of PV single-axis tracking are required while the capacities of wind power plants remain at 83 GW. Thus, there are no further installations in wind power plants after 2030. This result documents the outstanding impact of low cost solar PV supported by low cost battery storage that lead to a solar PV electricity generation share of 79%, which is significantly higher than the average of about 40% found in the global average assumptions for the year 2030 [25], but also higher than the 48% solar PV share for the MENA region [66]. However, comparable results had been found already earlier for the case of Israel [30], where the solar PV share had be found for cost optimized systems to about 90% of the total electricity supply. It has to be noted that Israel has less good wind conditions as in Saudi Arabia, and [30] was done for assumptions about the year 2030. Breyer et al. [41] discuss the significant role of solar photovoltaics, estimated to have an electricity generation share of 69% by 2050, in the global energy transition. The low cost for solar PV and battery storage can be explained by the standard experience curves in Figure 4 [67,68,69].
With the phasing out of fossil fueled thermal power plants, battery storage comes into play by 2025. By this time period, about 22% of the energy generation share is accounted for by fossil fueled thermal power plants. As the electricity demand increases and the share of renewables in the system increases, the battery storage required continues to increase. By 2050, batteries provide a total output of about 329 TWhel accounting for approximately 40% of the total electricity demand. For a 100% RE scenario by 2040, the required battery storage output is 203 TWhel accounting for approximately 32% of the total electricity demand. Between, 2025 and 2050, the battery full charge cycles required are between 300 and 330 cycles a year, indicating the almost daily usage of the battery capacity.
PtG plants come into effect in 2035 with 12 GWel of input capacity and increases to 73 GWel by 2050. Similarly, the FLH of the PtG plants increase from about 4313 h in 2035 to 4900 h by 2050. However, the gas storage output contributes about 2.3% towards the total electricity demand by 2050, significantly less than the 40% of batteries. The PtG plants also produce the SNG required to meet the industrial gas demand, as highlighted in Figure 12a.
The LCOE of the energy system is dominated by the high fuel cost in 2015. However, with the phasing out of the fossil powered thermal plants and the decreased consumption of fossil fuel, the LCOE of the energy system reduces from 139 €/MWhel in 2015 to 43 €/MWhel in 2040 and further to 41 €/MWhel in 2050.
Figure 10c illustrates that by 2020 onwards, the dominating contributor to the LCOE is the LCOEprimary. With the increase in storage capacities, both the LCOEprimary and LCOS are the largest contributors to the system LCOE. Figure 9d further shows that by 2050, the largest contributors are PV single-axis tracking and battery storage. However, by 2040, there is still a significant contribution by the existing wind power plants to the LCOE. This is in spite of the fact that new installations of wind power plants cease after 2030, due to the arising competitiveness of hybrid PV-battery plants.
Figure 13 presents the increasing desalination demand in the Kingdom of Saudi Arabia and the desalination capacities installed to meet the total water demand. The difference between the total water demand and desalination capacity is to be met through renewable water resources and some non-renewable ground water resources. SWRO and MED stand alone desalination plant capacities are optimized to meet the increasing desalination demand. The heat demand of the MED stand alone plants are met through the energy system. The existing MSF cogeneration and stand alone plants are phased out by 2035. After 2015, MSF stand alone plants are not allowed in the model due to the high thermal energy consumption. Similarly, MSF and MED cogeneration plants are not modelled due to the need for fossil powered gas plants. In an integrated scenario, the desalination capacities are used to better utilize the hourly renewable energy production of the power system. Figure 15 presents the variation in the average LCOW from 3.3 €/m3 in 2015 to 0.66 €/m3 in 2050.
The reduction in the LCOE of the system, contributes to the rapid decrease of the LCOW. The electricity costs for the desalination sector includes the energy consumption for water production at the desalination plant and transportation of water (vertical and horizontal transportation) to the demand site. By 2050, the transportation costs is the highest contributor to the LCOW followed by the desalination costs. Due to the low availability of heat losses in the system, there is a dominance of SWRO desalination plants which utilize no thermal energy.
To understand the impacts of integrating the desalination and power sectors in KSA, the LUT energy systems model was used to analyse both an integrated and non-integrated scenario. Thus, for the non-integrated scenario, the same desalination capacities are required, but they are not used to increase the flexibility of the power system. Figure 16a illustrates that the annualized levelised cost of the non-integrated scenario is higher than that of the integrated scenario for all time periods from 2020 to 2050. In fact, it is found that between 2040 and 2050, this reduction is between 1% and 3%, representing an annual cost decrease between 0.5 and 1.6 bn€. The lower cost is attributed to the reduced amounts of electricity storage, in the form of power-to-gas, required in the integrated scenario. Figure 16b highlights the lower curtailed energy ratio in the integrated scenario and the better utilization of the hourly renewable energy production.
Therefore, the above work presents a pathway for Saudi Arabia to transition to a 100% renewable energy power sector and shows that the integration of the country’s power and desalination sectors provides the least cost solution for both sectors.
It may be argued that the current electricity production costs in Saudi Arabia are lower than what this research presents for 2015. However, the artificially low fossil fuel prices in Saudi Arabia are a result of the high subsidies which, according to Al-Iriani et al. [70], account for 10% of the country’s GDP. As the energy consumption increases, the economic price the country has to pay increases. This is due to the heavily subsidized fuel prices that result in economic losses in the form of opportunity costs, since the export value of fuel would be much higher than the subsidized domestic consumption. With the decrease in oil prices and resulting revenue, as well as concerns about availability of fossil fuel resources to meet the country’s growing energy demand, Saudi Arabia has started the transition to less or no subsidies. Thus, our work offers a solution for Saudi Arabia to meet its growing energy demands through renewable energy, without hindering the future economic growth of the country. In addition, as demonstrated in this work, KSA can meet its own industrial gas demands by exploiting the country’s wealth of solar and wind resources.
This research also addresses how Saudi Arabia can meet the country’s growing water demand through the use of 100% renewable energy powered SWRO desalination plants. The average LCOW of KSA is found to be 0.66 €/m3 by 2050. This includes the cost for water desalination, water transportation to the demand site and water storage. Fthenakis et al. [71] estimated the current LCOW of a 190,000 m3/day SWRO plant, located in Al-Khajfi, on the east coast of KSA, powered by fixed-tilted PV to be 0.70 €/m3. Current water production costs of fossil powered SWRO plants in KSA lie between 0.65 €/m3–1.90 €/m3 [36]. However, this excludes the cost of transporting the desalinated water to the demand site and water storage.
There is a fast growing number of publications on 100% renewable energy-based energy systems [72], which helps to overcome the past concern that such systems would be neither technically feasible nor economically viable. This research on the case of Saudi Arabia is another confirmation of the high competitiveness of 100% RE systems. Recently Clack et al. [73] claimed that fossil-CCS and nuclear should be part of an energy system solution, which attracted stark criticism by Jacobson et al. [74]. One of the motivations for the critique was the fact that no single one of the about 60 existing articles on 100% RE systems had been mentioned in [73]. This reveals an imbalanced literature basement of the authors. Recent publications of IPCC researchers [75,76] also emphasize the substantial shares of renewable energy, and in particular on solar PV. Breyer et al. [41], recently presented an energy transition scenario for the world structured in 145 regions and simulated in full hourly resolution for the period 2015 to 2050 in 5 years steps. The research showed that 100% RE in the power system is possible, for lower global averaged cost than for the energy system of the year 2015. The energy transition has been further investigated by Ram et al. [77] who show that the transition also implies zero greenhouse gas emissions and a drastic increase in jobs in the power sector.

5. Conclusions

There is growing interest in the energy transition towards a 100% renewable energy-based power system in many countries and regions. Meanwhile, as the global renewable freshwater resource diminishes, seawater reverse osmosis desalination is expected to play a key role in securing future water supplies.
Saudi Arabia is the world’s largest producer of crude oil and the 11th largest consumer. Economic growth of the country is tied closely to oil prices. To secure the country’s economy, the government recently heralded a future without oil. The new vision calls for increase in renewable energy capacities and at least 9 GW of installed RE capacity by 2023. Saudi Arabia is also the largest producer of desalinated water in the world and desalination will remain vital to the country’s future water supply.
The purpose of this research is to analyse the impact of integrating the large desalination demand into the country‘s 100% RE-based power system by 2050. The power sector is integrated with the non-energy industrial gas sector of Saudi Arabia. Thus, RE is used to produce SNG to satiate the industrial gas demands. The increasing desalination demand is met through SWRO and MED stand alone plants.
It is found that the integration of the power, gas sector and the desalinated water sector, allows for a reduction of 1–3% of the levelised annual costs, in comparison to the non-integrated scenario. The LCOE and LCOW for Saudi Arabia by 2050, in the integrated scenario, is estimated to be 41 €/MWh and 0.66 €/m3, respectively. By 2050, PV single-axis tracking dominates the power sector in Saudi Arabia with about 79% of total generated electricity due to the further reduction in capex of solar PV and supporting battery technology over wind power plants. In addition, SWRO plants produce most of the desalinated water required. MED stand alone plants contribute when there is sufficient heat available in the energy system. In future research, it is planned to integrate the heat sector into the model. This may lead to more free heat in the energy system resulting in an increase in the MED capacities installed. In the presence of cheap heat source, MED is favourable to SWRO due to its lower electricity consumption.
Thus, the results present a least cost transition path for Saudi Arabia to meet the country’s future electricity and water demands through a 100% RE system.
However, there are gaps in the research methodology and data for Saudi Arabia that could be summarised as below:
  • Better understanding of the potential for geothermal and CSP heat use for MED desalination in Saudi Arabia.
  • No well-defined learning curve for SWRO desalination plants: This makes it difficult to project the future SWRO costs.
By filling in the gaps in our research, we can further refine our results and provide the optimal transition pathway for Saudi Arabia to finally start the country’s future without oil. By capitalising on the country’s excellent solar and wind resources through the implementation of renewable energy, Saudi Arabia can indeed meet the country’s future electricity, water and gas demands in a lucrative manner.

Acknowledgments

The authors gratefully acknowledge the scholarship offered by the Reiner Lemoine-Foundation and public financing of Tekes, the Finnish Funding Agency for Innovation, for the ‘Neo-Carbon Energy’ project under the number 40101/14.

Author Contributions

Upeksha Caldera carried out the research, including collecting the input data, implementing the energy system modelling, generating and analysing the results, and writing the manuscript. Dmitrii Bogdanov did the coding for the model used in this research. Svetlana Afanasyeva visualized and developed the figures. Christian Breyer framed the research questions and scope of the work, checked the results, facilitated discussions, and reviewed the manuscript.

Conflicts of Interest

The authors declare no conflict of interest. The founding sponsors had no role in the design of the study; in the collection, analyses, or interpretation of data; in the writing of the manuscript, and in the decision to publish the results.

Nomenclature

aannum
dday
A-CAESadiabatic compressed air storage
BWRObrackish water reverse osmosis
Capexcapital expenditures
CCGTcombined cycle gas turbine
CSPconcentrating solar power
crfcapital recovery factor
GCCGulf Corporation Council
GORgain output ratio
GWIglobal water intelligence
HRSGheat recovery steam generator
IWPPindependent water and power project
KSAKingdom of Saudi Arabia
LCOClevelised cost of curtailment
LCOElevelised cost of electricity
LCOGlevelised cost of gas
LCOWlevelised cost of water
MSFmulti stage flash
MEDmulti effect distillation
NWSnational water strategy
OCGTopen cycle gas turbine
Opexoperational expenditures
PtGpower-to-gas
PtHpower-to-heat
PVphotovoltaic
RErenewable energy
SECspecific energy consumption
SoCstate of charg
SNGsynthetic natural gas
SWROseawater reverse osmosis
WACCweighted average cost of capital

Appendix A

Table A1. Technical and Financial Assumptions of all energy system components used in the energy transition from 2015 to 2050 for KSA. Assumptions are taken from Pleßmann et al. [78] and European Commission [79] and further references are individually mentioned.
Name of Component Unit20152020202520302035204020452050Reference
PV optimally tiltedCapex€/kWp1000580466390337300270246[80,81]
Opex fix€/(kWp·a)1513.211.810.69.68.88.07.4
Opex var€/(kWh)00000000
Lifetimeyears3030353535404040
PV single-axis trackingCapex€/kWp1150638513429371330297271[80,81]
Opex fix€/(kWp·a)17.315.013.012.011.010.09.08.0
Opex var€/(kWh)00000000
Lifetimeyears3030353535404040
Wind onshoreCapex€/kW1250115010601000965940915900[82]
Opex fix€/(kW·a)2523212019191818
Opex var€/(kWh)00000000
Lifetimeyears2525252525252525
CSP (solar field, parabolic trough)Capex€/m2270240220200180170150140[83,84]
Opex fix%2.32.32.32.32.32.32.32.3
Opex var-00000000
Lifetimeyears2525252530303030
GeothermalCapex€/kW52504970472044704245402038153610[79,85]
Opex fix€/(kW·a)80.080.080.080.080.080.080.080.0
Opex var€/(kWh)00000000
Lifetimeyears4040404040404040
Water electrolysisCapex€/kW800685500380340310280260[86,87]
Opex fix€/(kW·a)3227201514121110
Opex var€/(kWh)0.00120.00120.00120.00120.00120.00120.00120.0012
Lifetimeyears3030303030303030
MethanationCapex€/kW492421310234208190172160[86,87]
Opex fix€/(kW·a)108654433
Opex var€/(kWh)0.00150.00150.00150.00150.00150.00150.00150.0015
Lifetimeyears3030303030303030
CO2 direct air captureCapex€/kW749641470356314286258240[86,87]
Opex fix€/(kW·a)29.925.618.814.212.611.410.39.6
Opex var€/(kWh)0.00130.00130.00130.00130.00130.00130.00130.0013
Lifetimeyears3030303030303030
CCGTCapex€/(kWel)775775775775775775775775[88]
Opex fix€/(kWel·a)19.419.419.419.419.419.419.419.4
Opex var€/(kWh)00000000
Efficiency%5858585859606060
Lifetimeyears3535353535353535
OCGTCapex€/(kWel)475475475475475475475475[88]
Opex fix€/(kWel·a)14.2514.2514.2514.2514.2514.2514.2514.25
Opex var€/(kWh)00000000
Efficiency%4343434343434343
Lifetimeyears3535353535353535
Steam turbine (CSP)Capex€/(kWel)760740720700670640615600[88,89]
Opex fix€/(kWel·a)15.214.814.41413.412.812.312
Opex var€/(kWh)00000000
Efficiency%4242424344444545
Lifetimeyears2525252530303030
Steam turbine (coal-fired PP)Capex€/(kWel)15001500150015001500150015001500[88,89]
Opex fix€/(kWel·a)2020202020202020
Opex var 00000000
Efficiency%4545454546464747
Lifetimeyears4040404040404040
Biomass CHPCapex€/kW34002900270025002300220021002000
Opex fix€/(kW·a)238203189175161154147140
Opex var€/(kWh)0.0010.0010.0010.0010.0010.0010.0010.001
Efficiency%36374043454747.548
Lifetimeyears3030303030303030
Biogas CHPCapex€/kW503429400370340326311296
Opex fix€/(kW·a)20.117.216.014.813.613.012.411.8
Opex var€/(kWh)0.0010.0010.0010.0010.0010.0010.0010.001
Efficiency%3536394244464647
Lifetimeyears3030303030303030
Waste incineratorCapex€/kW59405630544052405030487046904540
Opex fix€/(kW·a)267.3253.35244.8235.8226.35219.15211.05204.3
Opex var€/(kWh)0.00690.00690.00690.00690.00690.00690.00690.0069
Efficiency%273132.53435.53729.542
Lifetimeyears3030303030303030
Biogas digesterCapex€/kW771731706680653632609589
Opex fix€/(kW·a)30.829.228.227.226.125.324.323.6
Opex var€/(kWh)00000000
Efficiency%100100100100100100100100
Lifetimeyears2020202025252525
Biogas upgradeCapex€/kW340290270250230220210200[90]
Opex fix€/(kW·a)27.223.221.62018.417.616.816
Opex var€/(kWh)00000000
Efficiency%9898989898989898
Lifetimeyears2020202025252525
Battery, Li-ionCapex€/(kWhel)6003002001501201008575[91]
Opex fix€/(kWhel·a)2412864.843.43
Opex var€/(kWhthroughput)0.00020.00020.00020.00020.00020.00020.00020.0002
Efficiency%9091929394959595
Lifetimeyears1520202020202020
Thermal Energy Storage (TES)Capex€/(kWhth)5040303020202020
Opex fix€/(kWhth·a)0.750.60.450.450.30.30.30.3
Opex var€/(kWhthroughput)00000000
Lifetimeyears2525252530303030
Adiabatic compressed air energy storage (A-CAES)Capex€/kWh35.035.033.031.130.429.828.026.3
Opex fix€/(kWh·a)0.460.460.430.400.400.390.360.34
Opex var€/(kWh)0.00120.00120.00120.00120.00120.00120.00120.0012
Efficiency%5459657070707070
Lifetimeyears4055555555555555
Gas storageCapex€/kWhth0.050.050.050.050.050.050.050.05
Opex fix€/(kWh·a)0.0010.0010.0010.0010.0010.0010.0010.001
Opex var€/(kWh)00000000
Lifetimeyears5050505050505050
Table A2. Technical and financial parameters of the seawater desalination technologies from 2015–2050 [36,37,47,54,55,56,57,58,59,60,61,62].
Name of Component20152020202520302035204020452050
Sea Water Reverse OsmosisCapex€/(m3∙day)1150960835725630550480415
Opex fix€/(m3∙day)4638332925221917
Energy consumptionkWh/m34.13.63.353.1532.852.72.6
Lifetimeyears2525303030303030
Multi Effect Distillation—Thermal Vapor Compression
for stand alone
Capex€/(m3∙day)143712001043906787687600519
Opex fix€/(m3∙day)1013.215.61821.6242424
Thermal energy consumptionkWhth/m36851443832282828
Electrical energy consumptionkWhel/m31.51.51.51.51.51.51.51.5
Lifetimeyears2525252525252525
Multi Effect Distillation—Thermal Vapor Compression
for cogeneration
Capex€/(m3∙day)14371437143714371437143714371437
Opex fix€/(m3∙day)47.447.447.447.447.447.447.447.4
Thermal energy consumption (Total gas input required for water and electricity)kWhth/m3168168168168168168168168
Electrical energy consumptionkWhel/m31.51.51.51.51.51.51.51.5
Lifetimeyears2525252525252525
Multi Stage Flash
for cogeneration Gain Output Ratio: 8 Power-to-Water: 2.25 kW/(m3∙day)
Capex€/(m3∙day)20002000200020002000200020002000
Opex fix€/(m3∙day)100100100100100100100100
Thermal energy consumption (Total gas input required for water and electricity)kWhth/m3202.5202.5202.5202.5202.5202.5202.5202.5
Electrical energy consumptionkWhel/m32.52.52.52.52.52.52.52.5
Lifetimeyears2525252525252525
Multi Stage Flash
for stand alone Gain Output Ratio: 8
Capex€/(m3∙day)20002000200020002000200020002000
Opex fix€/(m3∙day)100100100100100100100100
Thermal energy consumptionkWhth/m38585858585858585
Electrical energy consumptionkWhel/m32.52.52.52.52.52.52.52.5
Lifetimeyears2525252525252525
Water Transportation
PipingCapex€/(m3∙a∙km)0.0530.0530.0530.0530.0530.0530.0530.053
Fixed Opex€/(m3∙a∙100 km)0.0230.0230.0230.0230.0230.0230.0230.023
Lifetimeyears3030303030303030
Vertical PumpingCapex€/(m3∙h∙m)15.415.415.415.415.415.415.415.4
Fixed Opex€/(m3∙h∙m)0.30.30.30.30.30.30.30.3
Energy consumptionkWh/(m3∙h∙100 m)0.360.360.360.360.360.360.360.36
Lifetimeyears3030303030303030
Horizontal PumpingCapex€/(m3∙h∙km)19.2619.2619.2619.2619.2619.2619.2619.26
Fixed Opex€/(m3∙h∙km)0.40.40.40.40.40.40.40.4
Energy consumptionkWh/(m3∙h∙100 km)0.040.040.040.040.040.040.040.04
Lifetimeyears3030303030303030
Water StorageCapex€/m36565656565656565
Fixed Opex€/m31.31.31.31.31.31.31.31.3
Lifetimeyears3030303030303030
Table A3. Energy to power ratio of the storage technologies.
TechnologyEnergy/Power Ratio (h)Self-Discharge
Battery60
TES100.002
A-CAES1000.001
Gas Storage80 × 240
Table A4. Key power capacities required for the energy transition pathway for KSA from 2015 to 2050.
TechnologyUnit20152020202520302035204020452050
PV single-axis trackingGWp0147387174243326378
PV optimally tiltedGWp0.080.080.080.080.080.070.070.002
Wind power plantsGW0008383838383
GeothermalGW01.61.722222
Battery storage outputTWh001.433.7131203269329
PtG electrolyser inputGWe000012397274
Gas StorageTWhth00.0020.0020.0030.0050.51516

References

  1. United Nations. Probabilistic Population Projections Based on the World Population Prospects: The 2015 Revision. Population Division; United Nations Department of Economic and Social Affairs (DESA): New York, NY, USA, 2015; Available online: http://esa.un.org/unpd/ppp/ (accessed on 12 February 2017).
  2. Salam, A.A.; Elsegaey, I.; Khraif, R.; Al-Mutairi, A. Population distribution and household conditions in Saudi Arabia: Reflections from the 2010 Census. SpringerPlus 2014, 3. [Google Scholar] [CrossRef]
  3. DeNicola, E.; Aburizaiza, S.O.; Siddque, A.; Khwaja, H.; Carpenter, O.D. climate change and water scarcity: The case of Saudi Arabia. Ann. Glob. Health 2015, 81, 342–352. [Google Scholar] [CrossRef] [PubMed]
  4. Drewes, J.E.; Garduno, R.P.C.; Amy, G. Water reuse in the Kingdom of Saudi Arabia–status, prospects and research needs. Water Sci. Technol. Water Supply 2012, 12, 926–936. [Google Scholar] [CrossRef]
  5. Global Water Intelligence Desal Data, Country Profile Saudi Arabia. 2016. Available online: https://www.desaldata.com/countries/31 (accessed on 12 August 2016).
  6. Global Water Intelligence. Top Market Opportunities Saudi Arabia. In Global Water Market 2017: Meeting the World’s Water and Wastewater Needs until 2020; Middle East and Africa; Media Analytics Publication: Oxford, UK, 2016; Volume 4, pp. 1379–1400. [Google Scholar]
  7. United Nations World Water Assessment Programme. The United Nations World Water Development Report 2014: Water and Energy; The United Nations Educational, Scientific and Cultural Organization (UNESCO): Paris, France, 2014; Available online: http://unesdoc.unesco.org/images/0022/002257/225741E.pdf (accessed on 2 February 2017).
  8. GE Power Water & Process Technologies. Saudi Digital Water Opportunities; General Electric (GE): Boston, MA, USA, 2016. [Google Scholar]
  9. World Energy Council. Global Energy Transitions: A Comparative Analysis of Key Countries and Implications for the International Energy Debate; World Energy Council: Berlin, Germany, 2014; Available online: www.atkearney.com/documents/10192/5293225/Global+Energy+Transitions.pdf/220e6818-3a0a-4baa-af32-8bfbb64f4a6b (accessed on 5 February 2017).
  10. Albassam, A.B. Economic diversification in Saudi Arabia: Myth or reality? Resour. Policy 2015, 44, 112–117. [Google Scholar] [CrossRef]
  11. King Abdullah City for Atomic and Renewable Energy. The Vision: Energy Sustainability for Future Generations, Riyadh, Saudi Arabia. 2016. Available online: www.kacare.gov.sa/en/FutureEnergy/Pages/vision.aspx (accessed on 10 March 2017).
  12. Moser, S.; Swain, M.; Alkhabbaz, H.M. King Abdullah Economic City: Engineering Saudi Arabia’s post-oil future. Cities 2015, 45, 71–80. [Google Scholar] [CrossRef]
  13. Farfan, J.; Breyer, C. Structural changes of global power generation capacity towards sustainability and the risk of stranded investments. J. Clean. Prod. 2016, 141, 370–384. [Google Scholar] [CrossRef]
  14. Black, I. Saudi Arabia Approves Ambitious Plan to Move Economy beyond Oil; The Guardian: London, UK, 2016; Available online: www.theguardian.com/world/2016/apr/25/saudi-arabia-approves-ambitious-plan-to-move-economy-beyond-oil (accessed on 10 March 2017).
  15. Apricum—The Cleantech Advisory. Saudi Arabia Unveils New Plan Including 9.5 GW of Renewable Energy; Apricum: Berlin, Germany, 2016; Available online: www.apricum-group.com/saudi-arabia-announces-9-5-gw-renewable-energy-target-new-king-salman-renewable-energy-initiative (accessed on 15 March 2017).
  16. New Energy Update. Saudi Arabia Seeks $50bn of Solar, Wind Investments; Jordan Agrees $60/MWh PV Price; New Energy Update: London, UK, 2017; Available online: http://analysis.newenergyupdate.com/energy-storage-pv-insider/photovoltaics/saudi-arabia-seeks-50bn-solar-wind-investments-jordan-agrees?utm_campaign=NEP%20PV%2018JAN17%20Newsletter&utm_medium=email&utm_source=Eloqua&elqTrackId=d8920d61149f4391a67ef77264a80a02&elq=6fc7d88267b9474780f52583e043cd34&elqaid=24874&elqat=1&elqCampaignId=11380 (accessed on 15 March 2017).
  17. Almasoud, A.H.; Gandayh, H.H. Future of solar energy in Saudi Arabia. J. King Saud Univ. Eng. Sci. 2014, 27, 153–157. [Google Scholar] [CrossRef]
  18. Breyer, C.; Schmid, J. Population density and area weighted solar irradiation: Global overview on solar resource conditions for fixed-tilted, 1-axis and 2-axis PV systems. In Proceedings of the 25th EUPVSEC/5th World Conference on Photovoltaic Energy Conversion, Valencia, Spain, 6–10 September 2010; Available online: http://bit.ly/2kEpz8w (accessed on 20 March 2017).
  19. Yamada, M. Vision 2030 and the Birth of Saudi Solar Energy, Middle East Institute Policy Focus 2016-15. 2016. Available online: www.mei.edu/sites/default/files/publications/PF15_Yamada_Saudisolar_web.pdf (accessed on 10 November 2017).
  20. Magazine, P.V. Saudi Arabia’s 300 MW Solar Tender May Conclude with Lowest Bid Ever. 2017. Available online: www.pv-magazine.com/2017/10/04/saudi-arabias-300-mw-solar-tender-may-conclude-with-lowest-bid-ever/ (accessed on 4 October 2017).
  21. Magazine, P.V. Interview: After Saudi Arabia, How Low Can Solar Prices Go? 2017. Available online: www.pv-magazine.com/2017/10/06/interview-after-saudi-arabia-how-low-can-solar-prices-go/ (accessed on 6 October 2017).
  22. Magazine, P.V. SoftBank Vision Fund to Build 3GW of Solar and Storage in Saudi Arabia. 2017. Available online: www.pv-magazine.com/2017/10/24/softbank-vision-fund-to-build-3-gw-of-solar-and-storage-in-saudi-arabia/ (accessed on 24 October 2017).
  23. Al-Kharaghouli, A.; Kazmerski, L.L. Energy consumption and water production cost of renewable energy powered desalination processes. Renew. Sustain. Energy Rev. 2013, 24, 343–356. [Google Scholar] [CrossRef]
  24. Caldera, U.; Bogdanov, D.; Breyer, C. Local cost of seawater RO desalination based on solar PV and wind energy: A global estimate. Desalination 2016, 385, 207–216. [Google Scholar] [CrossRef]
  25. Breyer, C.; Bogdanov, D.; Gulagi, A.; Aghahosseini, A.; Barbosa, L.S.N.S.; Koskinen, O.; Barasa, M.; Caldera, U.; Afanasyeva, S.; Child, M.; et al. On the Role of Solar Photovoltaics in Global Energy Transition Scenarios. Prog. Photovolt. Res. Appl. 2017, 25, 727–745. [Google Scholar] [CrossRef]
  26. Breyer, C.; Koskinen, O.; Bogdanov, D. A low-cost power system for Europe based on renewable electricity. In Proceedings of the European Utility Week, Barcelona, Spain, 15–17 November 2016. [Google Scholar]
  27. Bogdanov, D.; Breyer, C. Eurasian Super Grid for 100% Renewable Energy power supply: Generation and storage technologies in the cost optimal mix. In Proceedings of the ISES Solar World Congress 2015, Daegu, Korea, 8–12 November 2015; Available online: http://bit.ly/1IP8AeN (accessed on 24 October 2017).
  28. Gulagi, A.; Bogdanov, D.; Choudhary, P.; Breyer, C. Electricity system based on 100% renewable energy for India and SAARC. PLoS ONE 2017, 12, e0180611. [Google Scholar] [CrossRef] [PubMed]
  29. Bogdanov, D.; Breyer, C. North-East Asian Super Grid for 100% Renewable Energy supply: Optimal mix of energy technologies for electricity, gas and heat supply options. Energy Convers. Manag. 2016, 112, 176–190. [Google Scholar] [CrossRef]
  30. Bogdanov, D.; Breyer, C. The Role of Solar Energy towards 100% Renewable power supply for Israel: Integrating solar PV, wind energy, CSP and storages. In Proceedings of the 19th Sede Boqer Symposium on Solar Electricity Production, Sede Boqer, Israel, 23–25 February 2015; Available online: http://bit.ly/1JlaiDI (accessed on 25 October 2017).
  31. Connolly, D.; Mathiesen, B.V. A technical and economic analysis of one potential pathway to a 100% renewable energy systems. Int. J. Sustain. Energy Plan. Manag. 2014, 1, 7–28. [Google Scholar]
  32. Center for Alternative Technology. Who is Getting Ready for Zero? A Report on the State of Play of Zero Carbon Modelling; Center for Alternative Technology: Powys, UK, 2015; Available online: http://zerocarbonbritain.org/en/ready-for-zero (accessed on 25 October 2017).
  33. Neo-Carbon Energy. Internet of Energy–Online Visualization Tool; Lappeenranta University of Technology: Lappeenranta, Finland, 2016; Available online: http://neocarbonenergy.fi/internetofenergy/# (accessed on 25 October 2017).
  34. Sterner, M. Bioenergy and Renewable Power Methane in Integrated 100% Renewable Energy Systems. Ph.D. Thesis, Faculty of Electrical Engineering and Computer Science, University of Kassel, Kassel, Germany, 2009. [Google Scholar]
  35. Lehner, M.; Tichler, R.; Steinmüller, H.; Koppe, M. Power-to-Gas: Technology and Business Models; Springer: Heidelberg, Germany, 2014. [Google Scholar]
  36. Fichtner. MENA Regional Water Outlook Part 2 Desalination Using Renewable Energy Final Report; Fichtner: Stuttgart, Germany, 2011. [Google Scholar]
  37. El-Nashar, A.M. Cogeneration for power and desalination–state of the art review. Desalination 2001, 134, 7–28. [Google Scholar] [CrossRef]
  38. Water Desalination Report. Saudi Arabia Desal Market Re-Ignited. 2017. Available online: www.desaldata.com/news/saudi-arabia-desal-market-re-ignited (accessed on 25 October 2017).
  39. Barbosa, L.S.N.S.; Bogdanov, D.; Vainikka, P.; Breyer, C. Hydro, wind and solar power as a base for a 100% Renewable Energy supply for South and Central America. PLoS ONE 2017, 12, e173820. [Google Scholar] [CrossRef] [PubMed]
  40. Aghahosseini, A.; Bogdanov, D.; Ghorbani, N.; Breyer, C. The role of a 100% renewable energy system for the future of Iran: Integrating solar PV, wind energy, hydropower and storage. Int. J. Environ. Sci. Technol. 2016. [Google Scholar] [CrossRef]
  41. Breyer, C.; Bogdanov, D.; Aghahosseini, A.; Gulagi, A.; Child, M.; Oyewo, A.S.; Farfan, J.; Sadovskaia, K.; Vainikka, P. Solar photovoltaics demand for the global energy transition in the power sector. Prog. Photovolt. Res. Appl. 2017, 1–19. [Google Scholar] [CrossRef]
  42. Al-Saleh, Y.; Upham, P.; Malik, K. Renewable Energy Scenarios for the Kingdom of Saudi Arabia; Tyndall Climate Change Research Center: Norwich, UK, 2008; Available online: www.tyndall.ac.uk/sites/default/files/wp125.pdf (accessed on 26 October 2017).
  43. Engelhard, M.; Hurler, S.; Weigand, A.; Giuliano, S.; Puppe, M.; Schenk, H.; Hirsch, T.; Moser, M.; Fichter, T.; Kern, J.; et al. Techno-economic analysis and comparison of CSP with hybrid PV-Battery Power Plants. In Proceedings of the 22nd Solar PACES, Abu Dhabi, United Arab Emirates, 12 October 2016; Available online: http://bit.ly/2ig0ZOE (accessed on 12 October 2017).
  44. IEA—International Energy Agency. World Energy Outlook 2014; IEA Publishing: Paris, France, 2014. [Google Scholar]
  45. Stackhouse, P.W.; Whitlock, C.H. (Eds.) Surface meteorology and solar energy (SSE) release 6.0. In NASA SSE 6.0, Earth Science Enterprise Program; National Aeronautic and Space Administration (NASA): Washington, DC, USA, 2008. Available online: http://eosweb.larc.nasa.gov/sse/ (accessed on 12 October 2017).
  46. Stackhouse, P.W.; Whitlock, C.H. Surface meteorology and solar energy (SSE) release 6.0 Methodology. In NASA SSE 6.0, Earth Science Enterprise Program; National Aeronautic and Space Administration (NASA): Washington, DC, USA, 2009. Available online: http://eosweb.larc.nasa.gov/sse/documents/SSE6Methodology.pdf (accessed on 12 October 2017).
  47. Global Water Intelligence Desal Data. Plant Database. 2016. Available online: www.desaldata.com/projects (accessed on 13 October 2017).
  48. Ministry of Water and Electricity. National Water Strategy: The Roadmap for Sustainability, Efficiency and Security of the Water Future in the KSA National Water Strategy, Presentation for Water Arabia 2013. 2013. Available online: www.sawea.org/pdf/waterarabia2013/Tue_Panel_Discussion/National_Water_Strategy.pdf (accessed on 13 October 2017).
  49. Mehzer, T.; Fath, H.; Abbas, Z.; Khaled, A. Techno-economic assessment and environmental impacts of desalination technologies. Desalination 2011, 266, 263–273. [Google Scholar] [CrossRef]
  50. Ghaffour, N.; Missimer, T.M.; Amy, G.L. Technical review and evaluation of the economics of water desalination: Current and future challenges for better water supply sustainability. Desalination 2013, 309, 197–207. [Google Scholar] [CrossRef]
  51. Gude, G.V.; Nirmalakhandan, N. Desalination at low temperatures and low pressures. Desalination 2009, 244, 239–247. [Google Scholar] [CrossRef]
  52. Inoue, K.; Abe, Y.; Murakami, M.; Mori, T. Feasibility study of desalination technology utilizing the temperature difference between seawater and inland atmosphere. Desalination 2006, 197, 137–153. [Google Scholar] [CrossRef]
  53. Arnau, D.A.P.; Onatwe, I.D.N.E.; Hanganu, D.A. System and Method for Desalinating Seawater. European Patent Application No. EP2011038219820110615, 19 November 2012. [Google Scholar]
  54. Loutatidou, S.; Chalermthai, B.; Marpu, P.R.; Arafat, H. Capital cost estimation of RO plants: GCC countries versus southern Europe. Desalination 2014, 347, 103–111. [Google Scholar] [CrossRef]
  55. Al-Zahrani, A.; Orfi, J.; Al-Suhaibani, Z.; Salim, B.; Al-Ansary, H. Thermodynamic analysis of a reverse osmosis desalination unit with energy recovery system. Procedia Eng. 2012, 33, 404–414. [Google Scholar] [CrossRef]
  56. M+W Group. Solar Seawater Desalination. In Visit of the MASDAR Test Plants in Ghantoot, UAE; M+W Central Europe GmbH Global Business Unit Energy: Stuttgart, Germany, 2016. [Google Scholar]
  57. Water Online. Ghalilah Desalination Plant Honored with Distinction Award for Desalination Plant of the Year at 2016 Global Water Awards. 2016. Available online: www.wateronline.com/doc/ghalilah-desalination-plant-honored-plant-of-the-year-at-global-water-awards-0001 (accessed on 13 October 2017).
  58. Elimelech, M.; Phillip, A.W. The future of seawater desalination: Energy, technology and the environment. Science 2011, 333, 712–717. [Google Scholar] [CrossRef] [PubMed]
  59. Reddy, K.V.; Ghaffour, N. Overview of the cost of desalinated water and costing methodologies. Desalination 2007, 205, 340–353. [Google Scholar] [CrossRef]
  60. Al-Mutaz, I.S.; Wazeer, I. Current status and future direction of MED-TVC technology. Desalin. Water Treat. 2015, 55. [Google Scholar] [CrossRef]
  61. Moser, M.; Trieb, F.; Fichter, T.; Kern, J.; Hess, D. A flexible techno-economic model for the assessment of desalination plants driven by renewable energies. Desalin. Water Treat. 2015, 55, 3091–3105. [Google Scholar] [CrossRef]
  62. Fath, H.; Sadik, A.; Mehzer, T. Present and future trends in the production and energy consumption of desalinated water in GCC countries. Int. J. Therm. Environ. Eng. 2013, 5, 155–165. [Google Scholar]
  63. Palenzuela, P.; Alarcon-Padilla, D.C.; Zaragoz, G.; Blanco, J. Comparison between CSP+MED and CSP+RO in Mediterranean area and MENA region: Techno-economic analysis. Energy Procedia 2015, 69, 1938–1947. [Google Scholar] [CrossRef]
  64. IEA—International Energy Agency. Key World Energy Statistics; IEA: Paris, France, 2015. [Google Scholar]
  65. Afanasyeva, S.; Breyer, C.; Engelhard, M. The Impact of Cost Dynamics of Lithium-Ion Batteries on the Economics of Hybrid PV-Battery-GT Plants and the Consequences for Competitiveness of Coal and Natural Gas-Fired Power Plants. Energy Procedia 2016, 99, 157–173. [Google Scholar] [CrossRef]
  66. Aghahosseini, A.; Bogdanov, D.; Breyer, C. The MENA Super Grid towards 100% Renewable Energy Power Supply by 2030. In Proceedings of the 11th International Energy Conference, Tehran, Iran, 30–31 May 2016; Available online: http://bit.ly/2iYvZCO (accessed on 13 October 2017).
  67. Kittner, N.; Lill, F.; Kammen, M.D. Energy storage deployment and innovation for the clean energy transition. Nat. Energy 2017, 2. [Google Scholar] [CrossRef]
  68. Schmidt, O.; Hawkes, A.; Gambhir, A.; Staffell, I. The future cost of electrical energy storage based on experience rates. Nat. Energy 2017, 2. [Google Scholar] [CrossRef]
  69. Breyer, C.; Afanasveya, S.; Brakemeier, D.; Engelhard, M.; Giuliano, S.; Puppe, M.; Schenk, H.; Hirsch, T.; Moser, M. Assessment of mid-growth of assumptions and learning rates for comparative studies of CSP and hybrid PV-battery power plants. AIP Conf. Proc. 2017, 1850. [Google Scholar] [CrossRef]
  70. Al-Iriani, A.M.; Trabelsi, M. The economic impact of phasing out energy consumption subsidies in GCC countries. J. Econ. Bus. 2016, 87, 35–49. [Google Scholar] [CrossRef]
  71. Fthenakis, V.; Atia, A.A.; Morin, O.; Bkayrat, R.; Sinha, P. New prospects for PV powered water desalination plants: Case studies in Saudi Arabia. Prog. Photovolt. Res. Appl. 2016, 24, 543–550. [Google Scholar] [CrossRef]
  72. Brown, T.W.; Bischof-Niemz, T.; Blok, K.; Breyer, C.; Elliston, B.; Lund, H.; Mathiesen, B.V. Response to ‘Burden of Proof: A Comprehensive Review of the Feasibility of 100% Renewable-Electricity Systems’. Renew. Sustain. Energy Rev. 2017. under review. Available online: https://arxiv.org/pdf/1709.05716.pdf (accessed on 13 October 2017).
  73. Clack, C.T.M.; Qvist, S.A.; Apt, J.; Bazilian, M.; Brandt, A.R.; Caldeira, K.; Davis, S.J.; Diakov, V.; Handschy, M.A.; Hines, P.D.H.; et al. Evaluation of a proposal for reliable low-cost grid power with 100% wind, water, and solar. Proc. Natl. Acad. Sci. USA 2017, 114, 6722–6727. [Google Scholar] [CrossRef] [PubMed]
  74. Jacobson, M.Z.; Delucchi, M.A.; Cameron, M.A.; Frew, B.A. The United States can keep the grid stable at low cost with 100% clean, renewable energy in all sectors despite inaccurate claims. Proc. Natl. Acad. Sci. USA 2017, 114, 5021–5023. [Google Scholar] [CrossRef] [PubMed]
  75. Creutzig, F.; Agoston, P.; Goldschmidt, C.J.; Luderer, G.; Nemet, G.; Pietzcker, R.C. The underestimated potential of solar energy to mitigate climate change. Nat. Energy 2017, 2. [Google Scholar] [CrossRef]
  76. Pehl, M.; Arvesen, A.; Humpenöder, F.; Popp, A.; Hertwich, E.G.; Luderer, G. Understanding future emissions from low-carbon power systems by integration of life-cycle assessment and integrated energy modelling. Nat. Energy 2017, 2, 939–945. [Google Scholar] [CrossRef]
  77. Ram, M.; Bogdanov, D.; Aghahosseini, A.; Oyewo, S.; Gulagi, A.; Child, M.; Fell, H.-J.; Breyer, C. Global Energy System Based on 100% Renewable Energy—Power Sector; Lappeenranta University of Technology and Energy Watch Group: Lappeenranta, Finland; Berlin, Germany, 2017; Available online: http://bit.ly/2hU4Bn9 (accessed on 14 October 2017).
  78. Pleßmann, G.; Erdmann, M.; Hlusiak, M.; Breyer, C. Global energy storage demand for a 100% renewable electricity supply. Energy Procedia 2014, 46, 22–31. [Google Scholar] [CrossRef]
  79. Joint Research Center. Energy Technology Reference Indicator Projections for 2010–2050; Joint Research Center Science and Policy Reports; Joint Research Center Institute for Energy and Transport: Petten, The Netherlands, 2014. [Google Scholar]
  80. ETIP-PV—European Technology and Innovation Platform Photovoltaics. The True Competitiveness of Solar PV—A European Case Study; ETIP-PV: Munich, Germany, 2017. [Google Scholar]
  81. Fraunhofer Institute for Solar Energy Systems ISE. Current and Future Cost of Photovoltaics—Long-Term Scenarios for Market Development, System Prices and LCOE of Utility-Scale PV Systems (Study on behalf of Agora Energiewende, Freiburg and Berlin); Fraunhofer Institute for Solar Energy Systems ISE: Freiburg, Germany, 2015. [Google Scholar]
  82. Neij, L. Cost development of future technologies for power generation—A study based on experience curves and complementary and bottom-up assessments. Energy Policy 2008, 36, 2200–2211. [Google Scholar] [CrossRef]
  83. Haysom, J.E.; Jafarieh, O.; Anis, H.; Hinzer, K.; Wright, D. Learning curve analysis of concentrated photovoltaic systems. Prog. Photovolt. Res. Appl. 2014, 23, 1678–1686. [Google Scholar] [CrossRef]
  84. Kutscher, C.; Mehos, M.; Turchi, C.; Glatzmaier, G.; Moss, T. Line-Focus Solar Power Plant Cost Reduction Plant; National Renewable Energy Laboratory: Golden, CO, USA, 2010.
  85. Sigfusson, B.; Uihelein, A. Joint Research Center Geothermal Energy Status Report; European Commission; Joint Research Center Institute for Energy and Transport: Petten, The Netherlands, 2015. [Google Scholar]
  86. Agora Energiewende. Stromspeicher in der Energiewende. 2014. Available online: www.agora-energiewende.de/fileadmin/Projekte/2013/speicher-in-der-energiewende/Agora_Speicherstudie_Web.pdf (accessed on 14 October 2017).
  87. Breyer, C.; Tsupari, E.; Tikka, V.; Vainikka, P. Power-to-Gas as an emerging profitable business through creating an integrated value chain. Energy Procedia 2015, 73, 182–189. [Google Scholar] [CrossRef]
  88. International Energy Agency. World Energy Investment Outlook; International Energy Agency: Paris, France, 2003. [Google Scholar]
  89. McDonald, A.; Schrattenholzer, L. Learning rates for energy technologies. Energy Policy 2001, 29, 255–261. [Google Scholar] [CrossRef]
  90. Urban, W.; Lohmann, H.; Girod, K. Abschlussbericht für das BMBF-Verbundprojekt Biogaseinspeisung; Fraunhofer UMSICHT: Oberhausen, Germany, 2009. [Google Scholar]
  91. Hoffmann, W. Importance and evidence for cost effective electricity storage. In Proceedings of the 29th European Photovoltaic Solar Energy Conference, Amsterdam, The Netherlands, 22–26 September 2014. [Google Scholar]
Figure 1. Total Installed Capacities by the beginning of 2015 in Saudi Arabia [13].
Water 10 00003 g001
Figure 2. Block diagram of the LUT Energy Systems model used for Saudi Arabia.
Water 10 00003 g002
Figure 3. Aggregated load curve for the year 2015 for Saudi Arabia.
Water 10 00003 g003
Figure 4. Variation in capex of power system components (a), CSP solar field (b), RE components (c) and storage components (d) assumed in the model.
Water 10 00003 g004
Figure 5. Aggregated feed in profiles in KSA for CSP solar fields (a), wind power plants (b), single-axis tracking PV (c) and optimally tilted PV (d).
Water 10 00003 g005
Figure 6. Industrial gas demand projection for Saudi Arabia from 2015 to 2050 [52].
Water 10 00003 g006
Figure 7. Installed capacities (a) and electricity produced (b) of the different power plants required from 2015 to 2050.
Water 10 00003 g007
Figure 8. FLH variation of the different power plants used in model (a) and additional capacities of different power plants required from 2015 to 2050 (b).
Water 10 00003 g008
Figure 9. Additional storage capacity (a) and storage output (b) required from 2015 to 2050.
Water 10 00003 g009
Figure 10. Contribution of different components (a), detailed contribution of components (b) relative contribution of different components (c) and relative contribution of financial components (d) to the total LCOE from 2015 to 2050.
Water 10 00003 g010
Figure 11. Annual CO2 emissions during the energy transition and the ratio (blue bars) and CO2 emissions per kWh of electricity produced (red line).
Water 10 00003 g011
Figure 12. The increase in industrial gas demand (red line) and the variation in levelised cost of gas (LCOG) (grey bars) (a) and gas in the system by source (b) from 2015 to 2050.
Water 10 00003 g012
Figure 13. Water desalination capacities required to meet KSA’s total water demand from 2015 to 2050.
Water 10 00003 g013
Figure 14. Water storage relative state of charge in 2030.
Water 10 00003 g014
Figure 15. Capex of all desalination sector components (a), annual fixed opex for desalination sector components (b), annual variable opex for desalination sector components (c) and LCOW variation (d) from 2015 to 2030.
Water 10 00003 g015
Figure 16. Comparison of total annual levelised cost (a) and the curtailed electricity (b) for the integrated and non-integrated scenarios.
Water 10 00003 g016
Table 1. Average energy consumption of prevalent seawater desalination technologies in the KSA [23].
Desalination TechnologyElectrical Energy Consumption (kWhe/m3)Thermal Energy Consumption (kWhth/m3)
Seawater Reverse Osmosis (SWRO)4.0-
Multi Stage Flash (MSF)2.5–5.085
Multiple Effect Distillation (MED)2.0–2.565
Table 2. Variation in the electrical energy consumption of Saudi Arabia from 2015 up to 2050 [44].
YearTotal Electricity Consumption (TWh)
2015289
2020330
2025377
2030431
2035492
2040563
2045643
2050734
Table 3. Estimation of biomass potentials and geothermal energy potential for Saudi Arabia from 2015–2050.
Solid Waste (TWhth/a)Solid Biomass (TWhth/a)Biogas Sources (TWhth/a)Geothermal Potential (TWhth/a)
1.924.141.9757.53
Table 4. Average full load hours (FLH) for CSP solar field, PV optimally tilted, PV single-axis tracking and wind onshore power plants in Saudi Arabia.
PV Single-AxisPV Optimally TiltedCSPWind Onshore
FLHFLHFLHFLH
2443183023822618
Table 5. Lower limits of installed capacities [MW] considered in this study for Saudi Arabia.
CountrySolar PV
KSA81.6
Table 6. Upper limits on installable capacities in Saudi Arabia in units of GWth for CSP and GWel for all other technologies.
CountryArea (1000 km2)Solar CSPSolar PVWind
KSA446.5193479673722
Table 7. Online capacities of seawater desalination in Saudi Arabia by 2015.
Desalination TechnologyTotal Online Capacity (m3/day)
SWRO2,736,238
MSF Stand Alone1,519,777
MSF Cogeneration2,727,021
MED Stand Alone1,507,074
MED Cogeneration975,371
Other technologies, including those that use brackish water220,324
Table 8. Desalination capacities required to meet KSA’s increasing total water demand.
Unit20152020202520302035204020452050
Populationmill31.5034.4036.8539.1341.2443.1444.7646.06
Total water demandmill m3/day65.468.575.681.088.696.7105.0112.6
Desalination demand based on [21]mill m3/day19.121.827.532.038.445.253.858.7
Final non-renewable water resource usedmill m3/day8.97.95.83.96.28.5.00
Actual desalination demandmill m3/day10.213.921.728.232.336.753.858.7
Installed capacities
SWROmill m3/day2.7
MSF Stand Alonemill m3/day1.52
MSF Cogenerationmill m3/day2.73
MED Stand Alonemill m3/day1.57
MED Cogenerationmill m3/day0.95
Table 9. Weighted average horizontal and vertical water pumping distances.
Unit20152020202520302035204020452050
Horizontal distancekm280273269265266267268269
Vertical distancem711721729736743749754758
Table 10. Energy Consumption of the desalination technologies during the transition.
Unit20152020202520302035204020452050
SWRO electricity consGWh4496.522,622.529,622.537,033.840,996.545,209.664,212.863,011.9
MSF-S electricity consGWh1386.80006.5000
MSF-C electricity consGWh2153.80000000
MED-S electricity consGWh114.600019.4000
MED-C electricity consGWh689.20000000
MSF-S heat consGWhth47,151.0000219.4000
MSF-C gas consGWhth174,456.50000000
MED-S heat consGWhth3898.62.31.94.7309.81.71.54
MED-C gas consGWhth59 809.70000000

